

Comparison of Globe and Flat-Earth Model Predictions with Reality
Autor: Walter Bislin
All Globe and Flat-Earth Model Predictions are computed with my Curvature App. Please note that the horizon of the Flat-Earth Model always is at Eye-Level of the Globe Model. On the Globe the horizon is never at Eye-Level so all objects near or behind the horizon are below Eye-Level too.
The Rainy Lake Experiment
The Rainy Lake Experiment was designed to show, how we can figure out the shape of the earth, Flat or a Globe, by observing a clever arrangement of targets over a distance of 10 km, taking terrestrial refraction into account and using modern equipment. The experiment is an advanced version of the Bedford Level experiment executed in 1838. The Experiment leads to the only conclusion that the earth is a Globe with a radius of 6371 km.
- Rainy Lake Experiment Animation
- The Rainy Lake Experiment, full report

- Swap
- Globe Prediction
- Flat Earth Prediction
 The Flat Earth model predicts that all Bedford targets appear aligned with the horizon and eye level, which does not match the observation. ⇒more
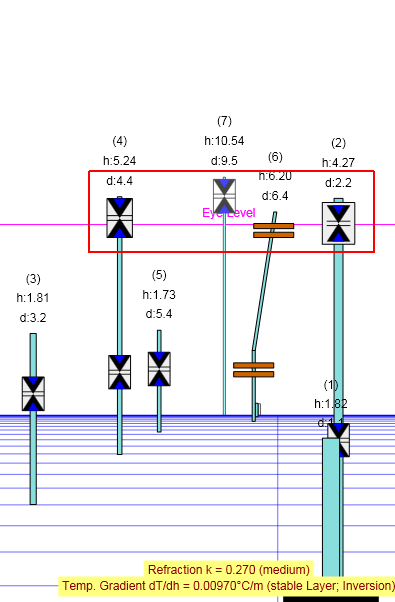
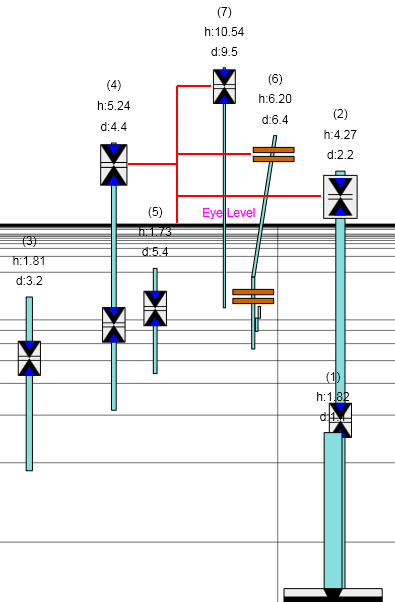
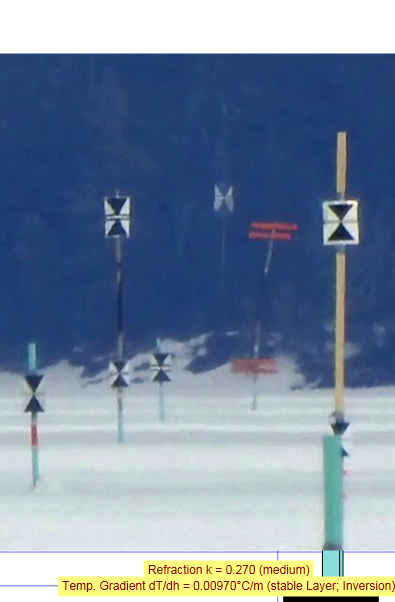
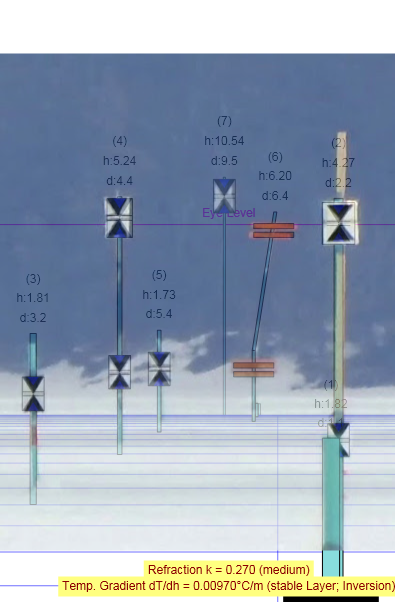
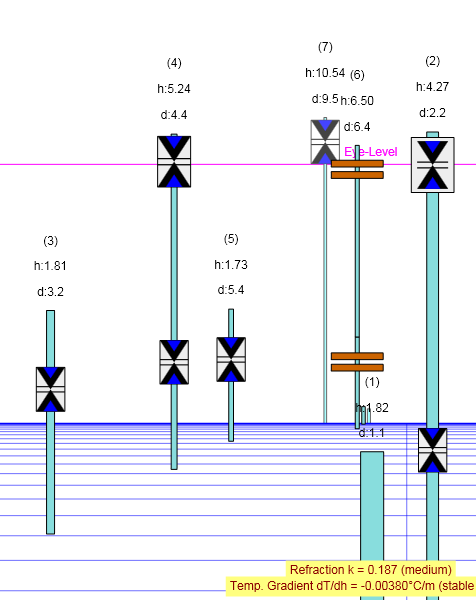

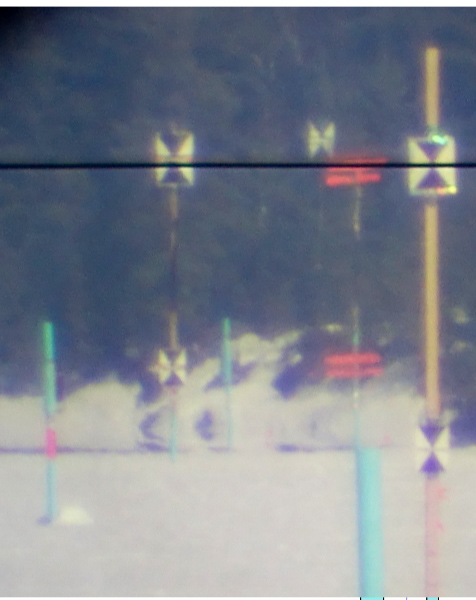

The Computer Model shows the predicted image using the measured target center heights, which match the observations very well. The Flat Earth prediction does not match the observation at all. ⇒more
Causeway View from Marriott Hotel

- Swap
- Globe Model
- Flat-Earth Model
 Real Image
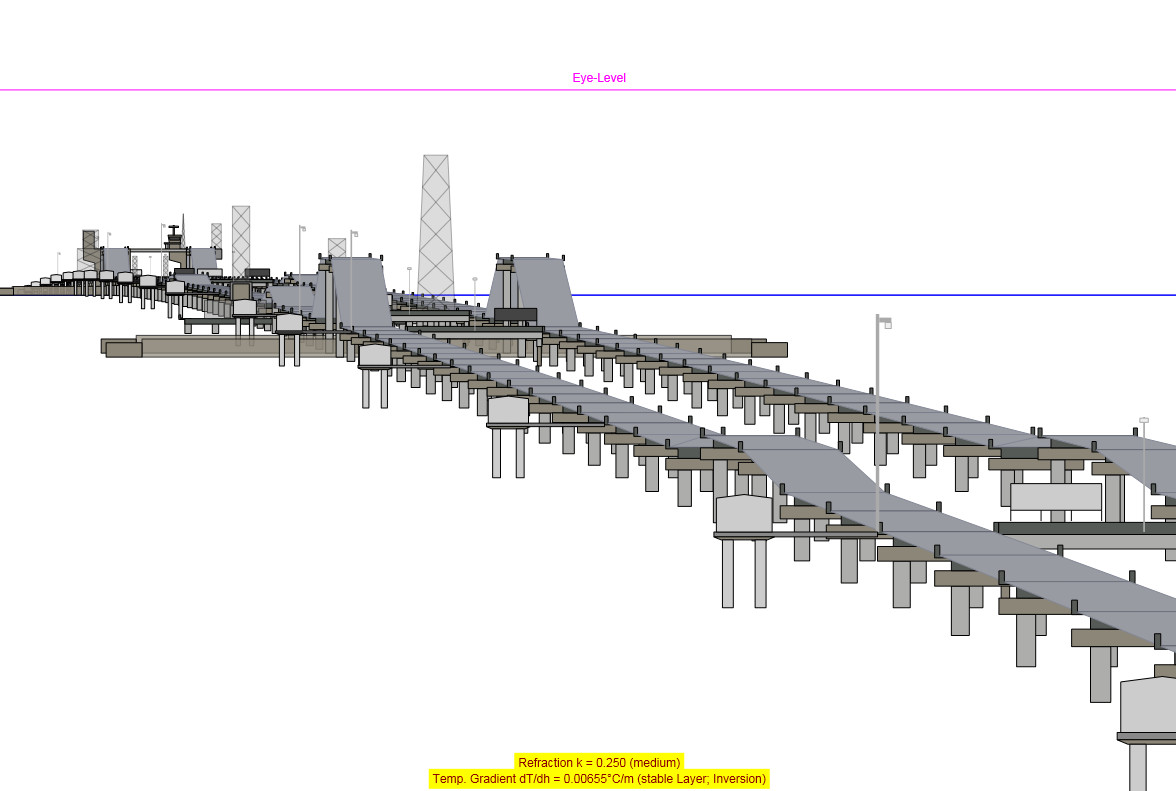
 Globe Model Prediction
- Blink Test
- Reality
- Globe Model
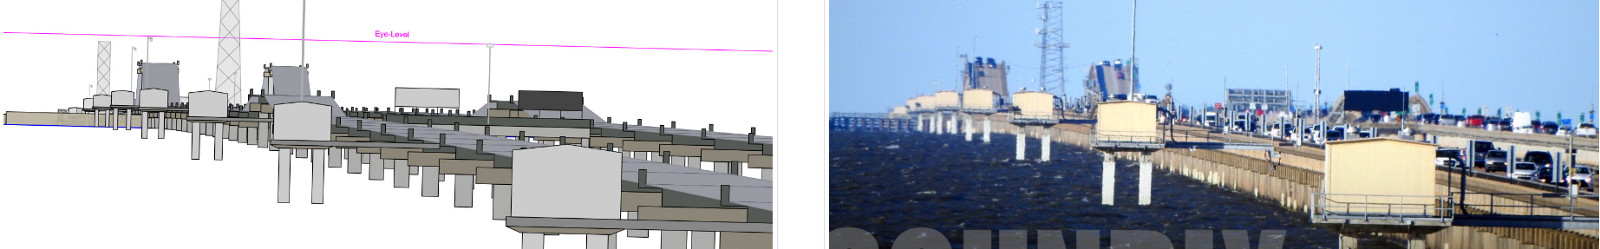
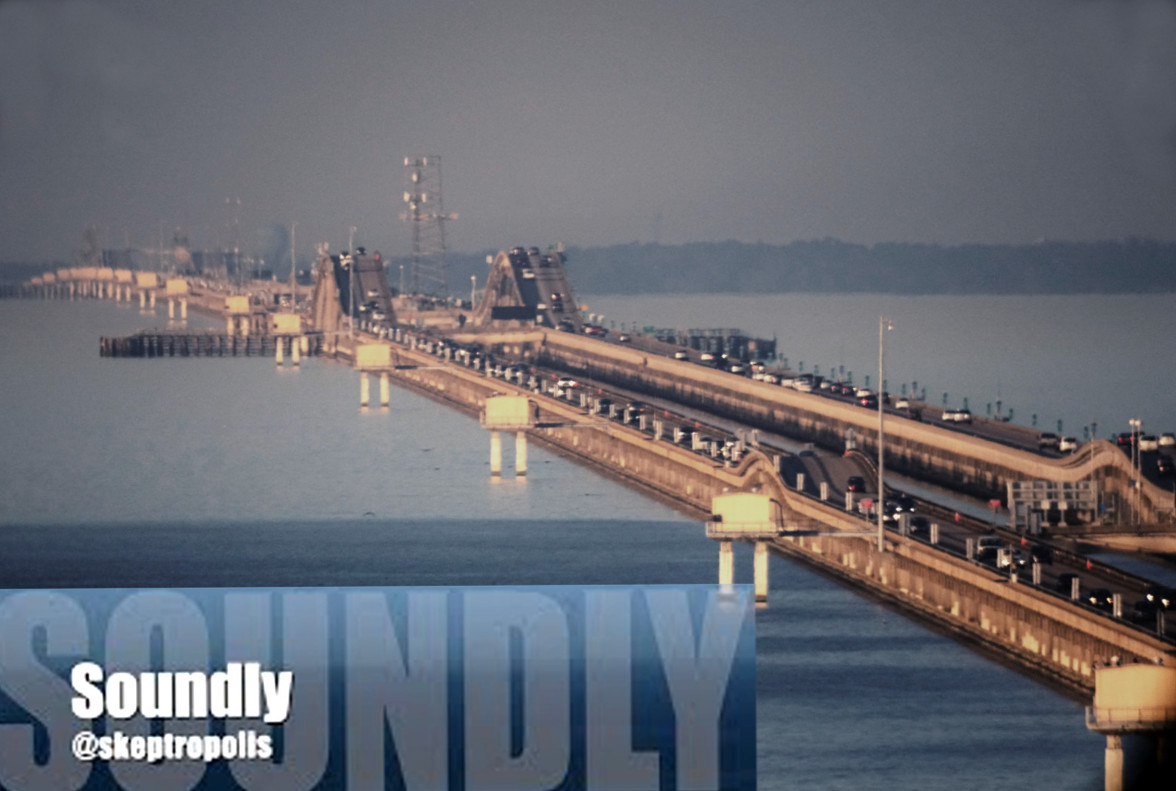
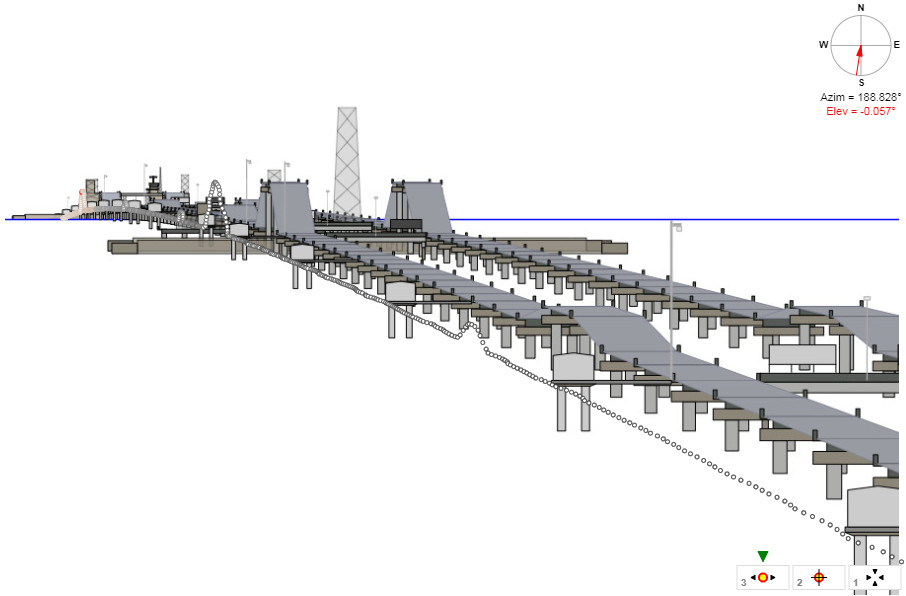
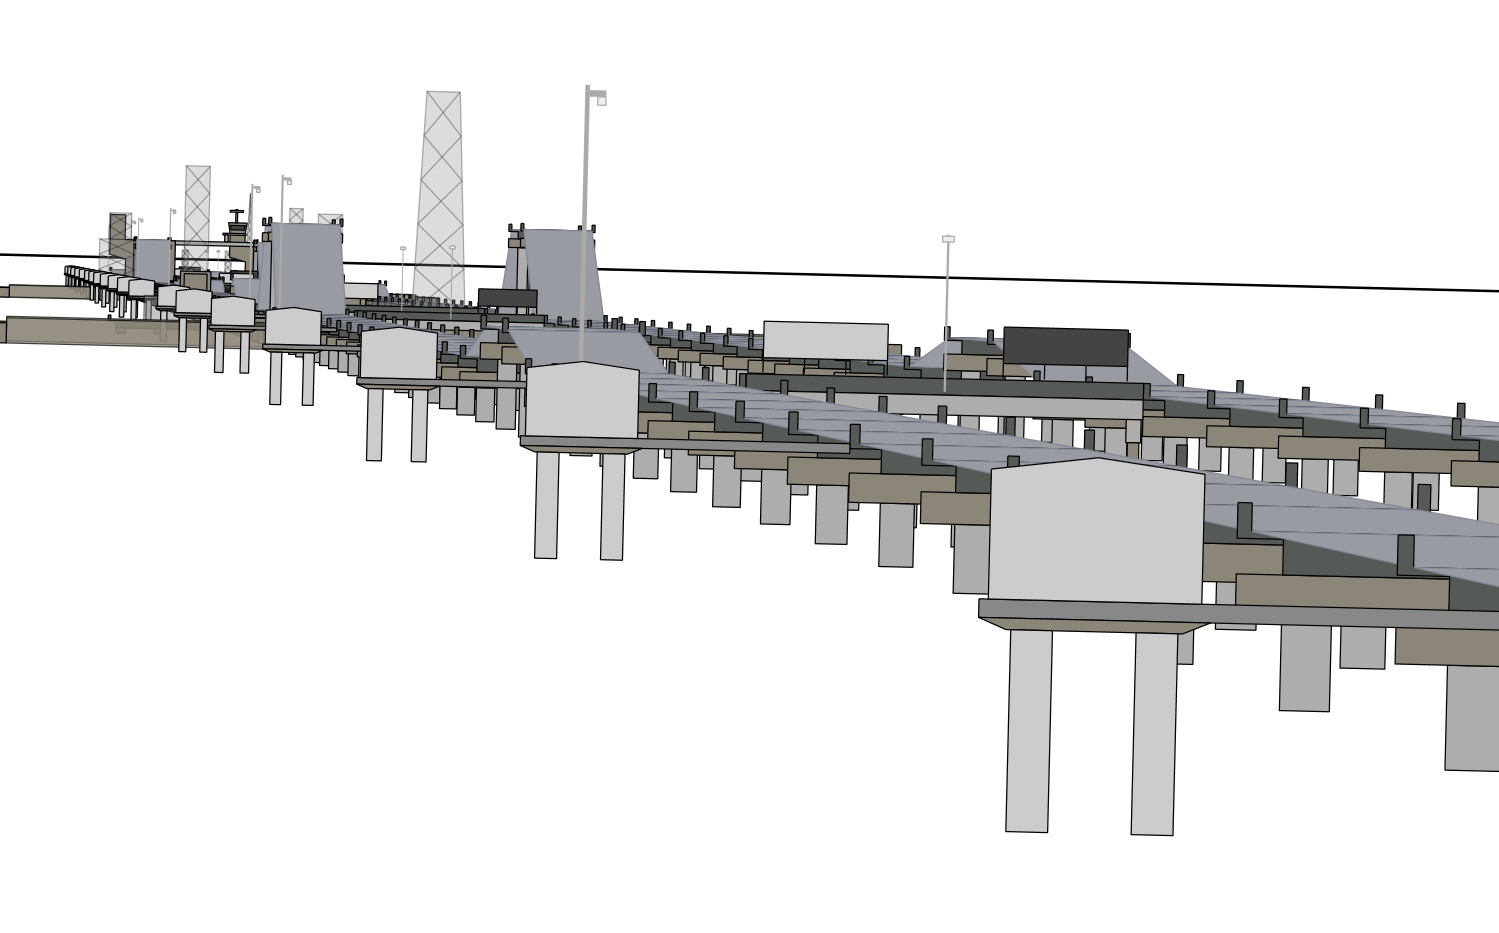
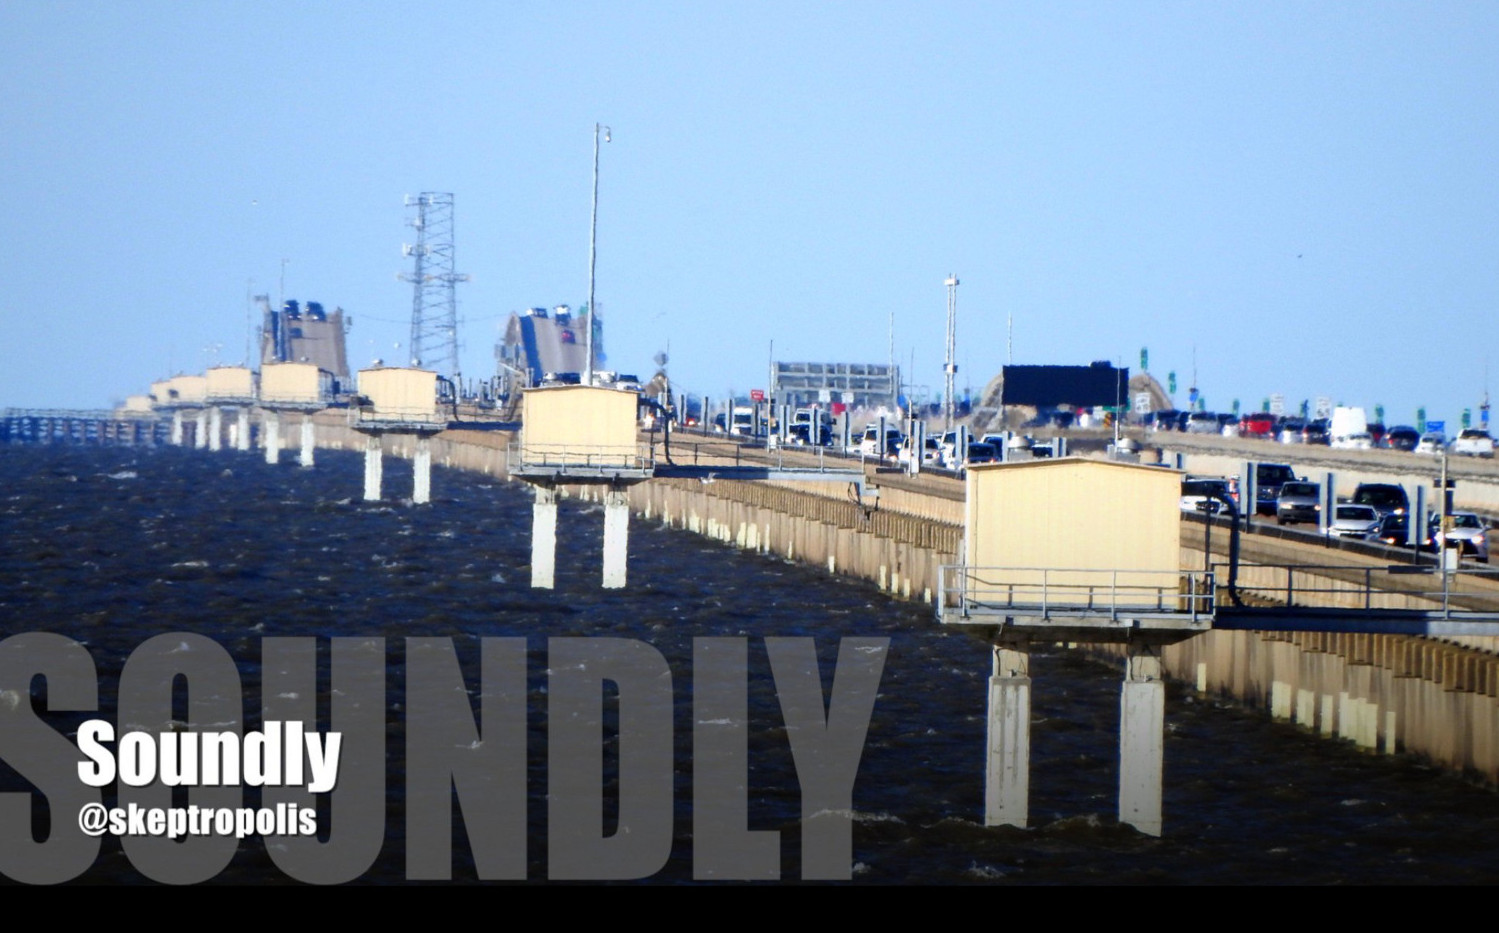
This scene shows the 38 km long Causeway Bridge at Lake Pontchartrain, Lousiana. The image was taken from the 15th floor of the Marriott Hotel at the south side of the lake using a telescope with a zoom factor of about 2000 mm (35 mm equivalent).
Source: Screenshot from Soundly’s Youtube Channel
Note: please click the description below the image to open the Curvature App and load the corresponding simulation.

Causeway GNSS Data match the Globe Model perfectly
Jesse Kozlowski measured both lanes of the Causeway using Differential GPS to 5 cm accuracy. The data gathered are 3D cartesian coordines, which represent points in space. The GPS measurements are not affected by refraction or perspective. So they represent the real geometric positions in space.
I imported the data in my Geo-Data Visualisation and Calculator App and superimposed an image from Soundly, taken from the 15th floor of the Mariott Hotel. Jesse also measured the 3D location of the window, from where the image was taken. So I could position the virtual camera of my App at this 3D position and align the image and the data as shown in the images on the right.
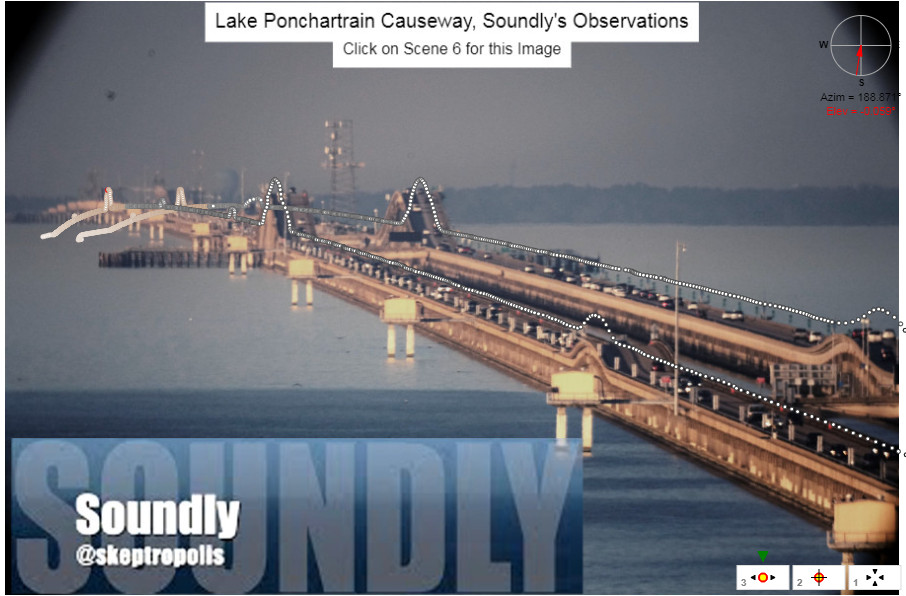

On this image refraction was less than on the image on the right. The image matches very well with the raw geometry data of the GPS/GNSS measurements.
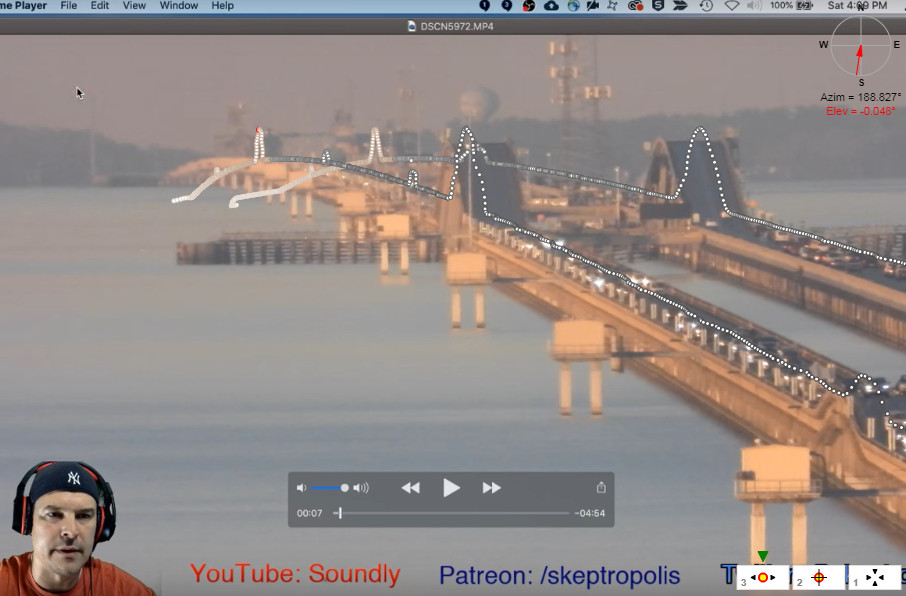

On this image refraction was stronger than on the left image. It loomes the far end of the bridge and the water tower recognizable up.
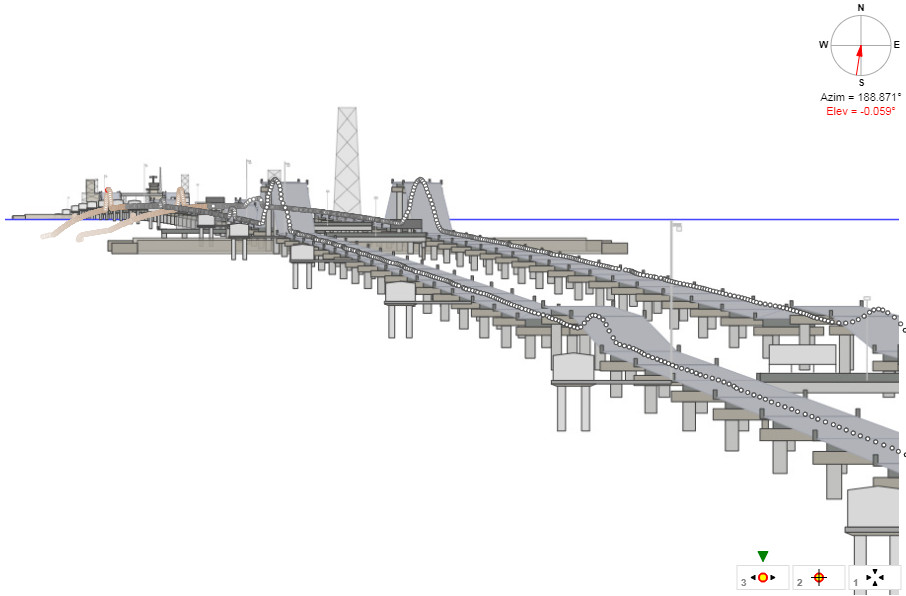


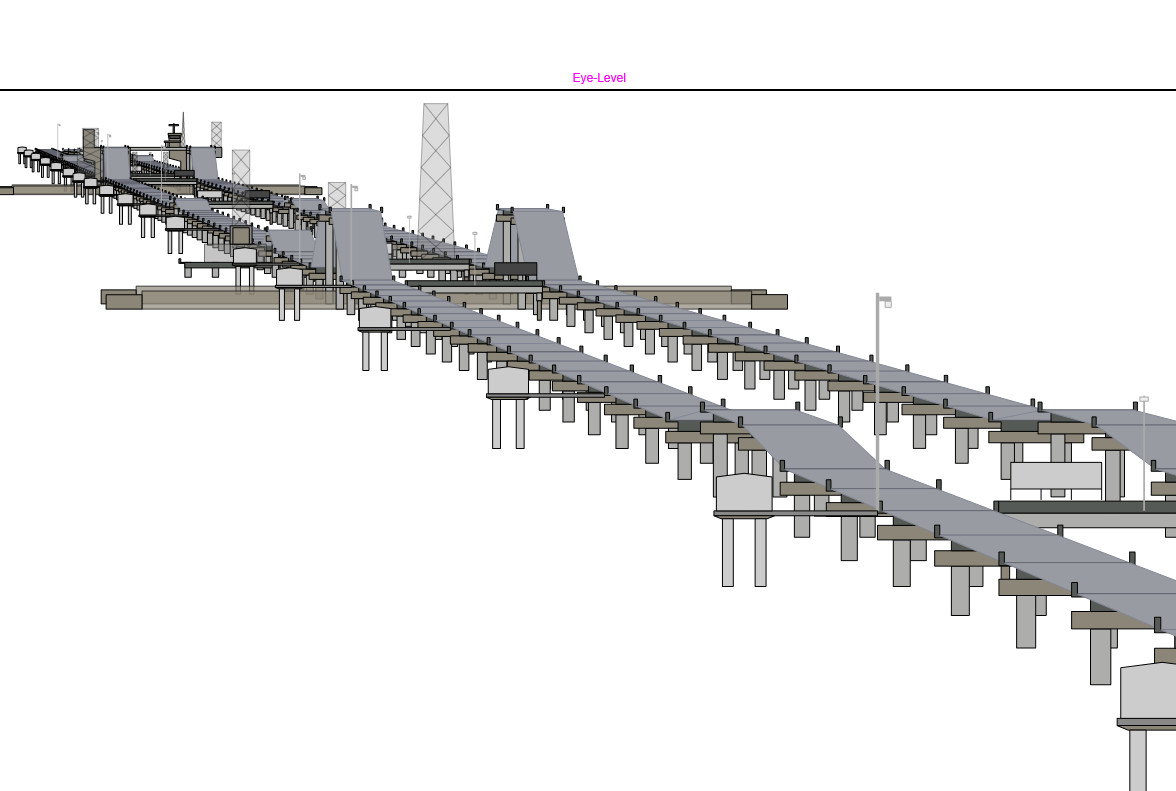
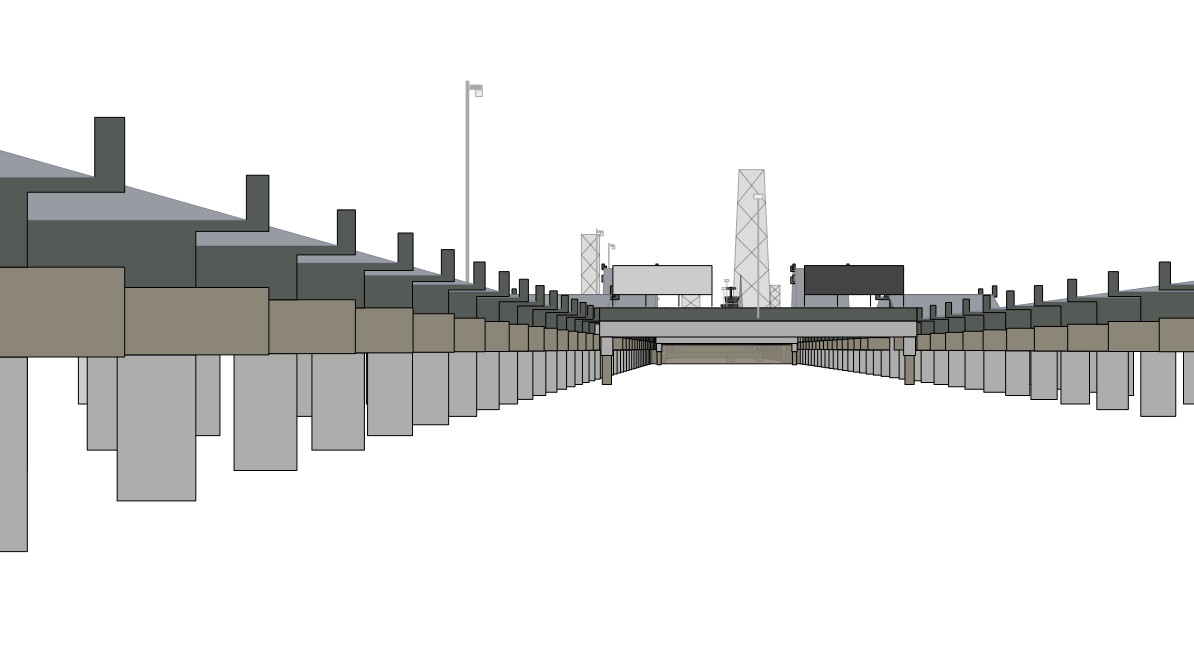
The same GPS/GNSS data matches the 3D Globe Model of the Causeway with refraction set to zero perfectly (click on the image to zoom in).
It is difficult to see the alignment of the data with the 3D Globe Model of the Causeway at the far end. So I displaced the measurements to the left and algined them with the base of the huts. Now we can recognize, that the measurements and the 3D model match perfectly.
Whith GPS/GNSS technology we have a method to measure the real geometry of the Causeway bridge. The geometry of the bridge is curving over the horizon, which means water is curved. The measured geometry matches the Globe Model of the bridge perfectly as expected, because the Globe Model is based on a sphere with radius 6371 km and the data gathered confirms that the earth is a spheere with radius 6371 km, see Causeway Measuring Radius of the Earth. The images show only slight deviations from the geometry due to refraction but the overall appearance is the same. So the images show definitively the real curvature of the earth.
The geometric horizon is where the datapoints begin to curve down (lighter brownish color of the points). The apparent horizon appears farther away and higher due to refraction (looming).
Causeway View to Hotel Marriott

- Swap
- Globe Model
- Flat-Earth Model

 Real Image
 Globe Model Prediction
 Real Image through Theodolite
- Blink Test
- Reality
- Globe Model
- Theodolite View
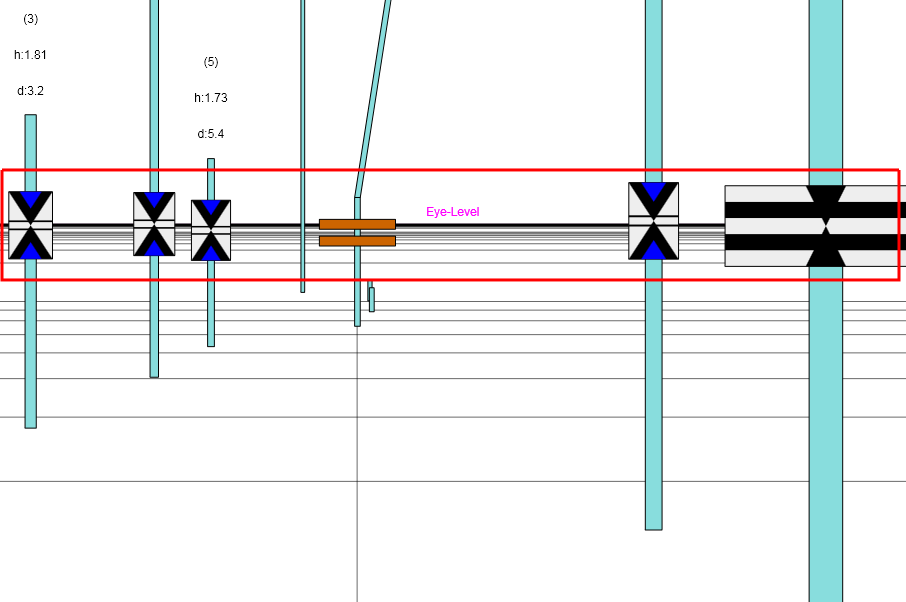
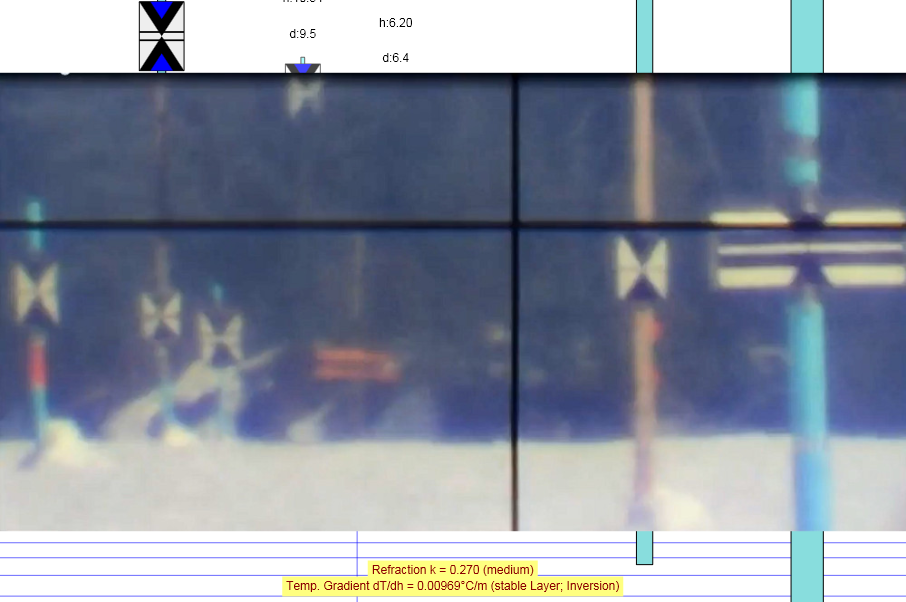
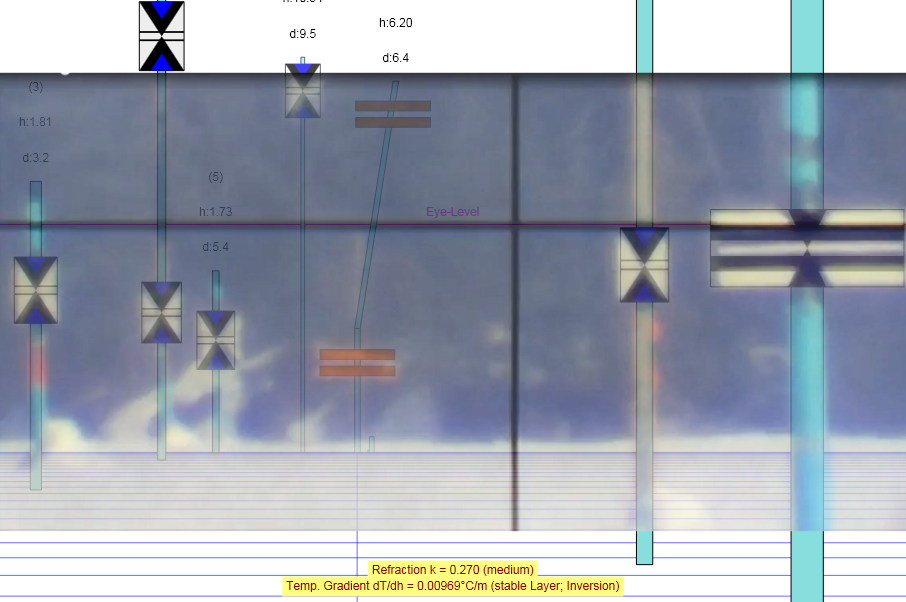
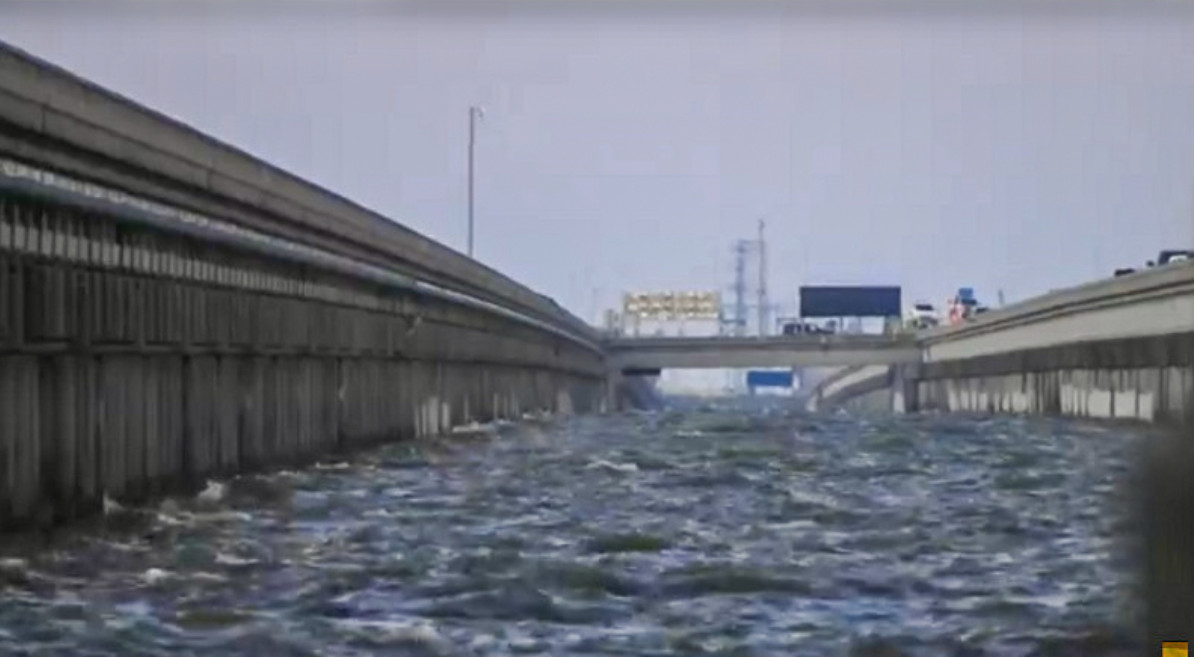
This scene shows the 38 km long Causeway Bridge at Lake Pontchartrain from the north side looking to the Marriott Hotel (Zoom about 3000 mm). Note that in the Theodolite View the horizontal line of the crosshair of the Theodolite is exactly at Eye-Level.
- Screenshot from: Blink Test Marriott (Flat Earth Debunk) by Soundly
- Theodolite View: Lake Pontchartrain 12/10/17 – Marriott Hotel Viewed From North Shore by Jesse Kozlowski
Causeway View Left

- Swap
- Globe Model
- Flat-Earth Model
 Real Image
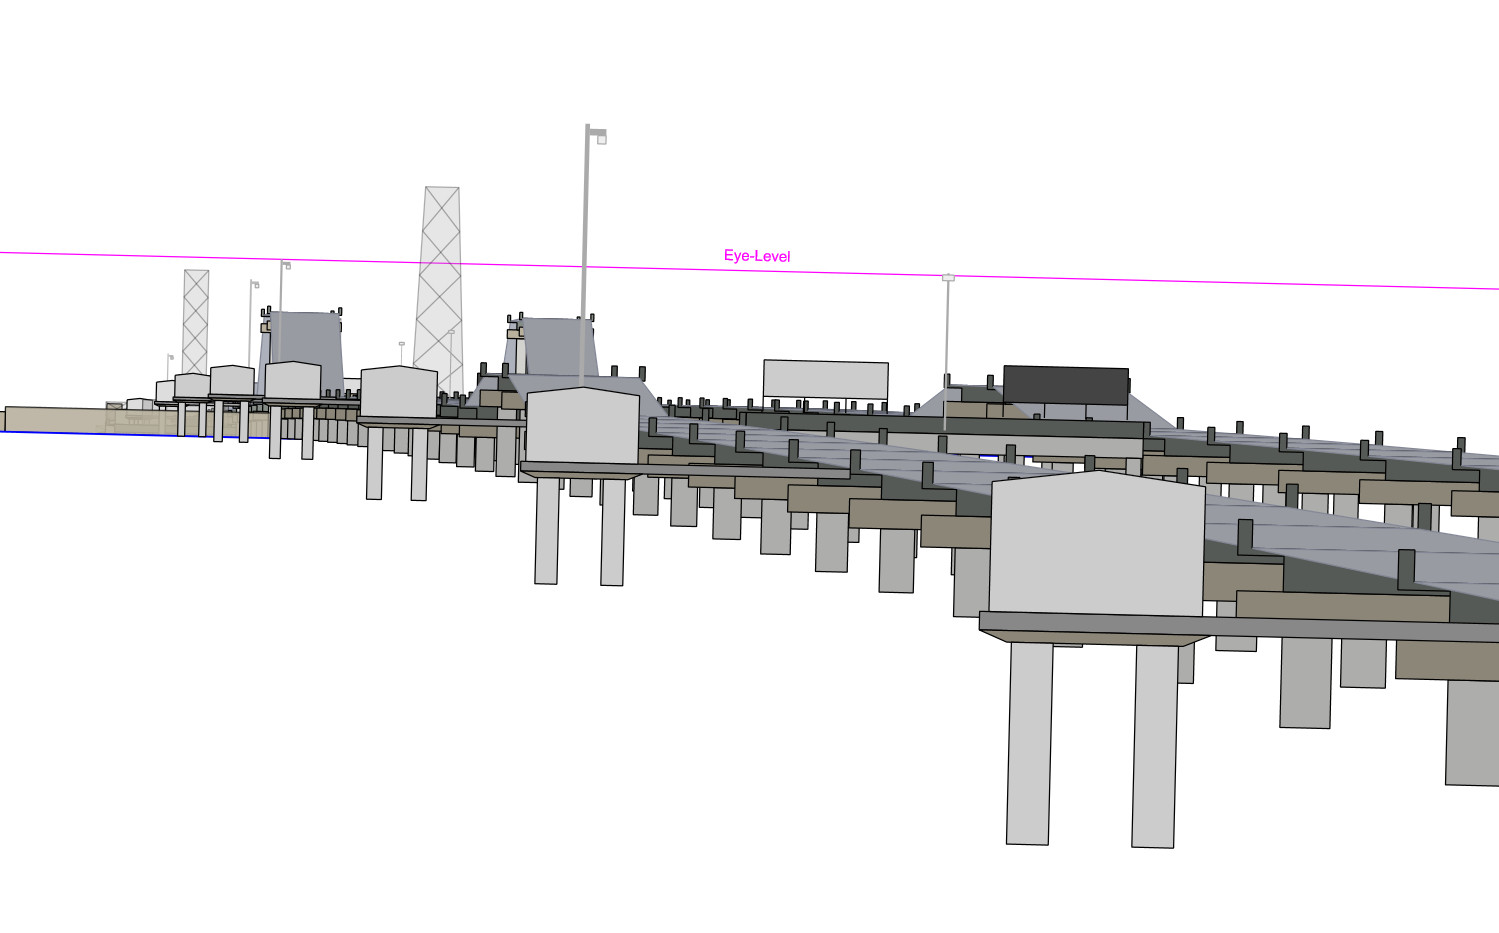
 Globe Model Prediction
- Blink Test
- Reality
- Globe Model
Source: Screenshot from Soundly’s Youtube Channel
Causeway View Center

- Swap
- Globe Model
- Flat-Earth Model
 Real Image
 Globe Model Prediction
- Blink Test
- Reality
- Globe Model
Source: Screenshot from Soundly’s Youtube Channel
Lake Ponchartrain Transmission Line
- Swap
- Globe Model
- Flat-Earth Model
 Real ImageGlobe Model Prediction
- Blink Test
- Reality
- Globe Model
This scene shows one of the Lake Pontchartrain Transmission Lines, which crosses the lake in a perfectly straigh line. Over a distance of 25.9 km there are 85 identical towers with a separation of 300 m. The towers have a height of 23 m. The last 2 towers have a height of 64 m.
Image from: Soundly Proving the Curvature of the Earth at Lake Pontchartrain (Metabunk); Soundly’s Youtube Channel
Steven Elliott has a very good Tutorial how to create a model of the transmission lines in Blender.
Below Eye Level, Miles Davis


- Swap
- Globe Model
- Flat-Earth Model


- Blink Test
- Reality
- Globe Model Overlayed
- Globe Model
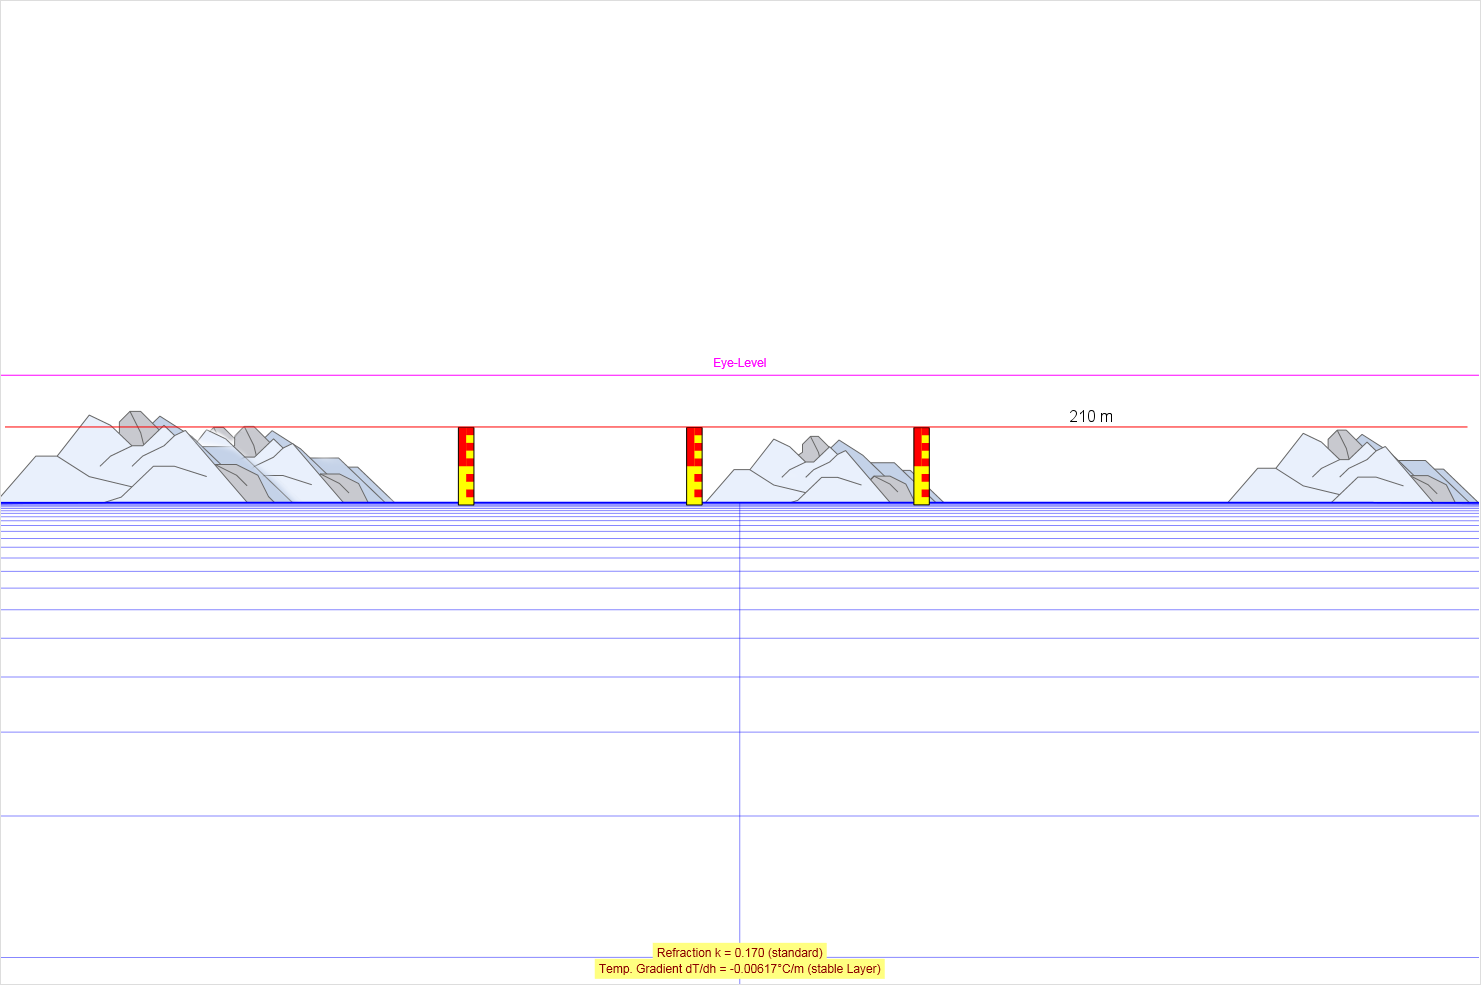
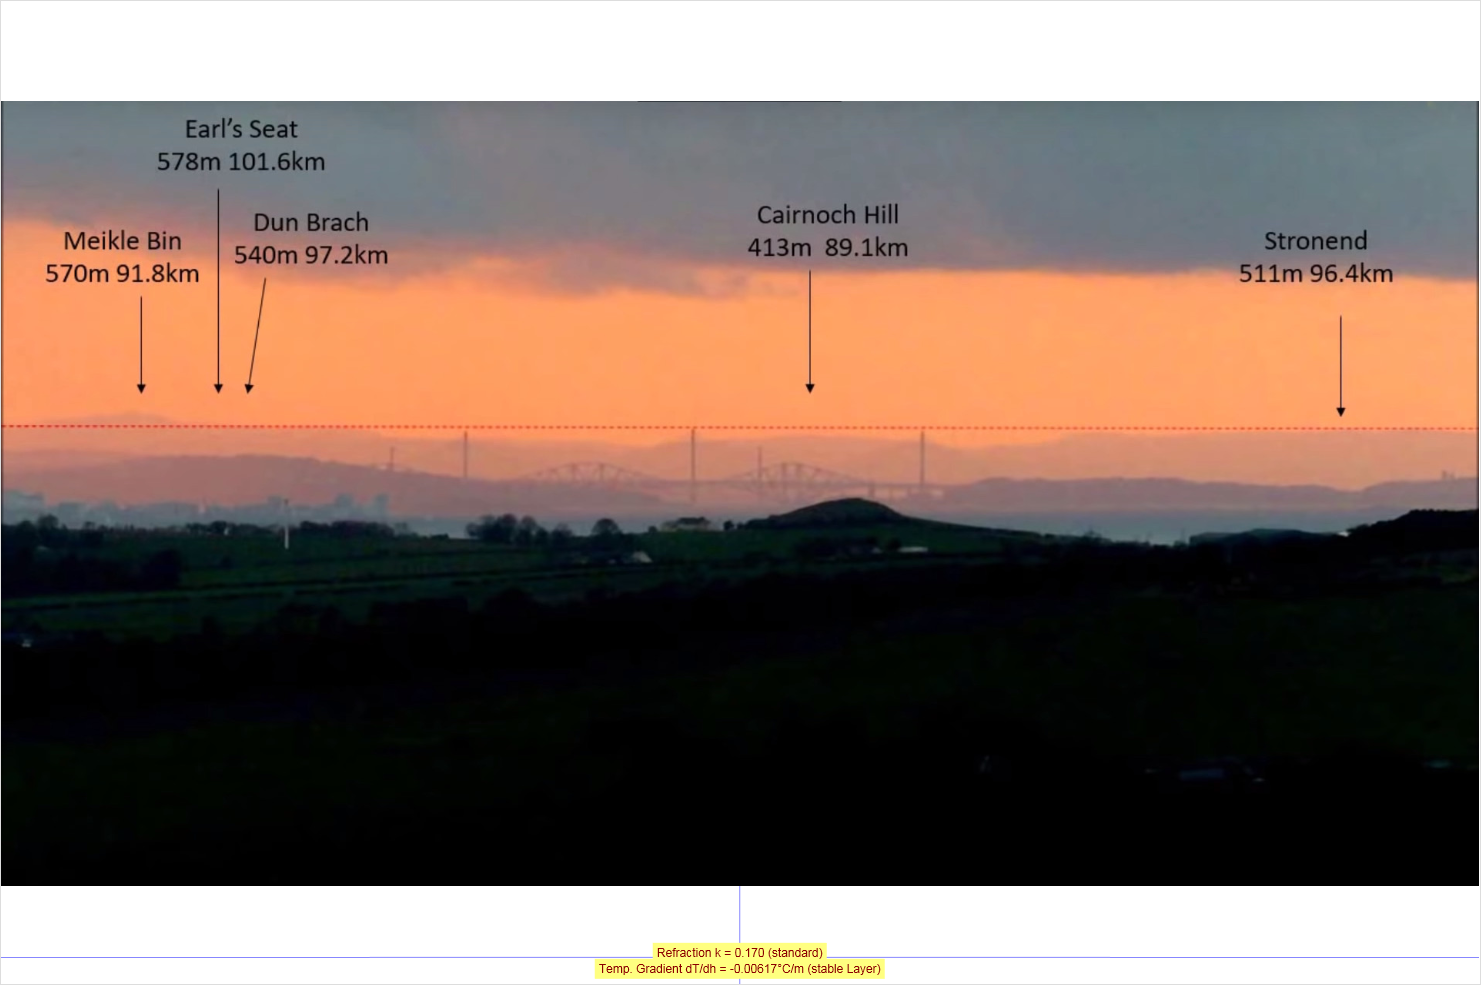
This observation from Miles Davis, like all other observations on this page, confirms without any doubt that the earth is a Globe. Miles Davis is at an altidude of 210 m. The middle bridge tower is at sea level and has a height of 210 m. All hills in the distance are far taller than 210 m but they appear below the 210 m line or only very slightly above.
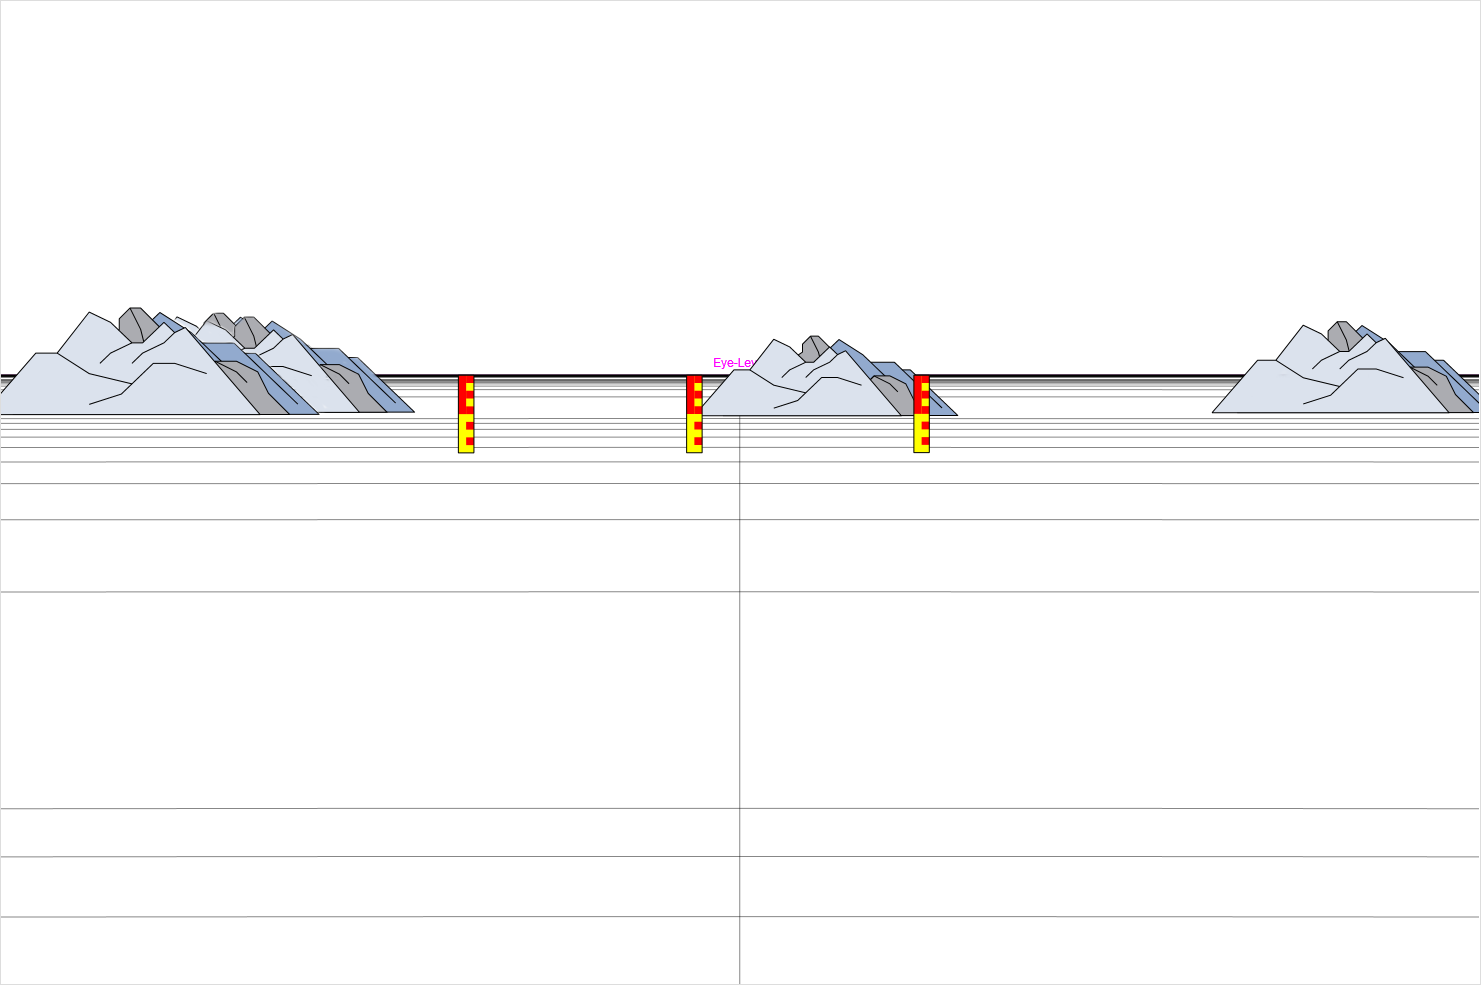
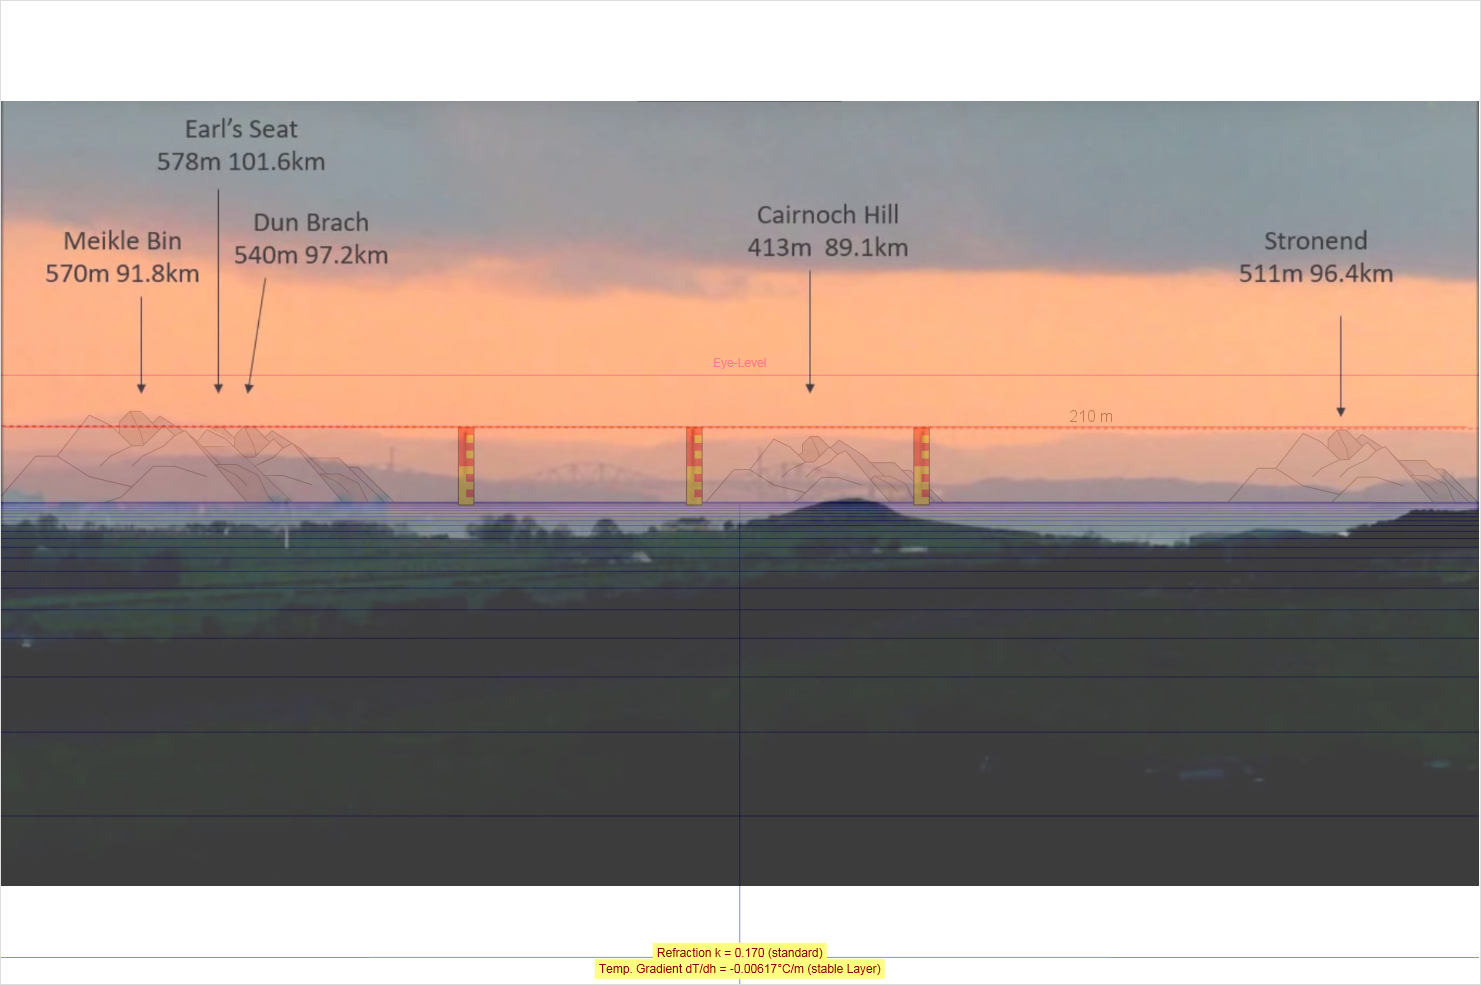
Note that the bridge towers and hills are all far below eye level. This can only be recognized in reality by using an auto level or theodolite. But anyway, the Flat Earth Model Prediction looks nowhere near like the image, while the Globe Model Prediction, using Standard Refraction, matches perfectly!
Note also, that even the bridge towers are the same height as the observer, they apear below eye level, because the earth curves down with increasing distance.
Observation Data Miles Davis
- Observer location: Traprain Law 55°57’47.32″N 2°40’21.19″W
- Bridge location: Edinburgh 56°0’16.38″N 3°24’45.32″W
You can click the links in the table below to open my Curvature App with the corresponding hill shown. You can than play with the settings. To change the transparency of the overlayed image, click on the image. Clicking left of the center makes it more transparent, clicking right more opaque.
| Hill | Height | Distance | SidePos | Coordinates |
|---|---|---|---|---|
| Earl’s Seat | 578 m | 101.6 km | −3000 m | 56°1’31.35″N 4°17’49.79″W |
| Dun Brach | 540 m | 97.2 km | −2700 m | 56°1’37.89″N 4°13’16.05″W |
| Meikle Bin | 570 m | 91.8 km | −3150 m | 56°0’50.40″N 4°8’18.11″W |
| Cairnoch Hill | 413 m | 89.1 km | 450 m | 56°1’14.56″N 4°0’2.16″W |
| Stronend | 511 m | 96.4 km | 3460 m | 56°4’43.46″N 4°12’10.34″W |
SidePos: is the horizontal distance from the center line of the image at the distance of the hill.
The observer Height in the Curvature App is set to 210 m and the Zoom to 420 mm. Standard Refraction of k = 0.17 is set. The measuring rods (bridge towers) are at a distance of 46.5 km from the observer and have a size of 210 m. Data providet by Miles Davis and confirmed by me using google earth.
Confirmation of Drop from Auto Level
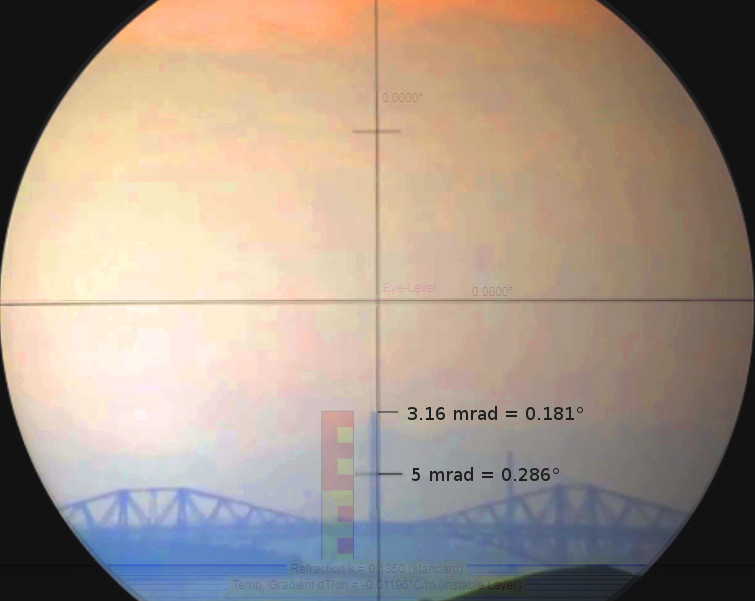
As the Curvature App image on the left above indicates with the magenta eye level line, the top of the bigger tower in Miles images has to be below eye level due to the curvature of the earth. Miles did not use an auto level so we can not say how much drop there is. But a Youtube user called Creamy Pasta did exactly the same observation at another day using an auto level (image on the right).
- Traprain Law visit by Creamy Pasta on Youtube
The 2 short lines on the vertical crosshair mark 5 mrad (milli rad) angle. The horizontal line marks eye level of the observer, which was at 210 m altitude. From that we can measure the drop angle α to the top of the tower by counting pixels in a graphics program. I measured a drop angle of 3.16 mrad = 0.181°.
How much drop angle does the globe predict? Matching the image with my Curvature App I got a refraction prevealing at the time the image was taken of k = 0.135, which is Standard Refraction.
Now lets calculate the expected drop angle of the top of the tower for the globe model and see if it matches the measured drop angle of 0.181°.
The drop angle φ due to the curvature of the earth, without refraction, can be calculated as follows:
| (1) | |||||||||||||
| where‘ |
|
Standard refraction loomes objects up. So we see a slightly smaller drop angle than the curvature drop angle. The refraction angle can be calculated as follows:
| (2) | |||||||||||||
| where‘ |
|
So the expected drop angle according to the globe model, taking standard refraction into account, is:
| (3) |
|
|||||||||
| where‘ |
|
This is exactly what we measure from the image through the auto level. This confirms again the earth is a globe with radius 6371 km.
Salt Lake City
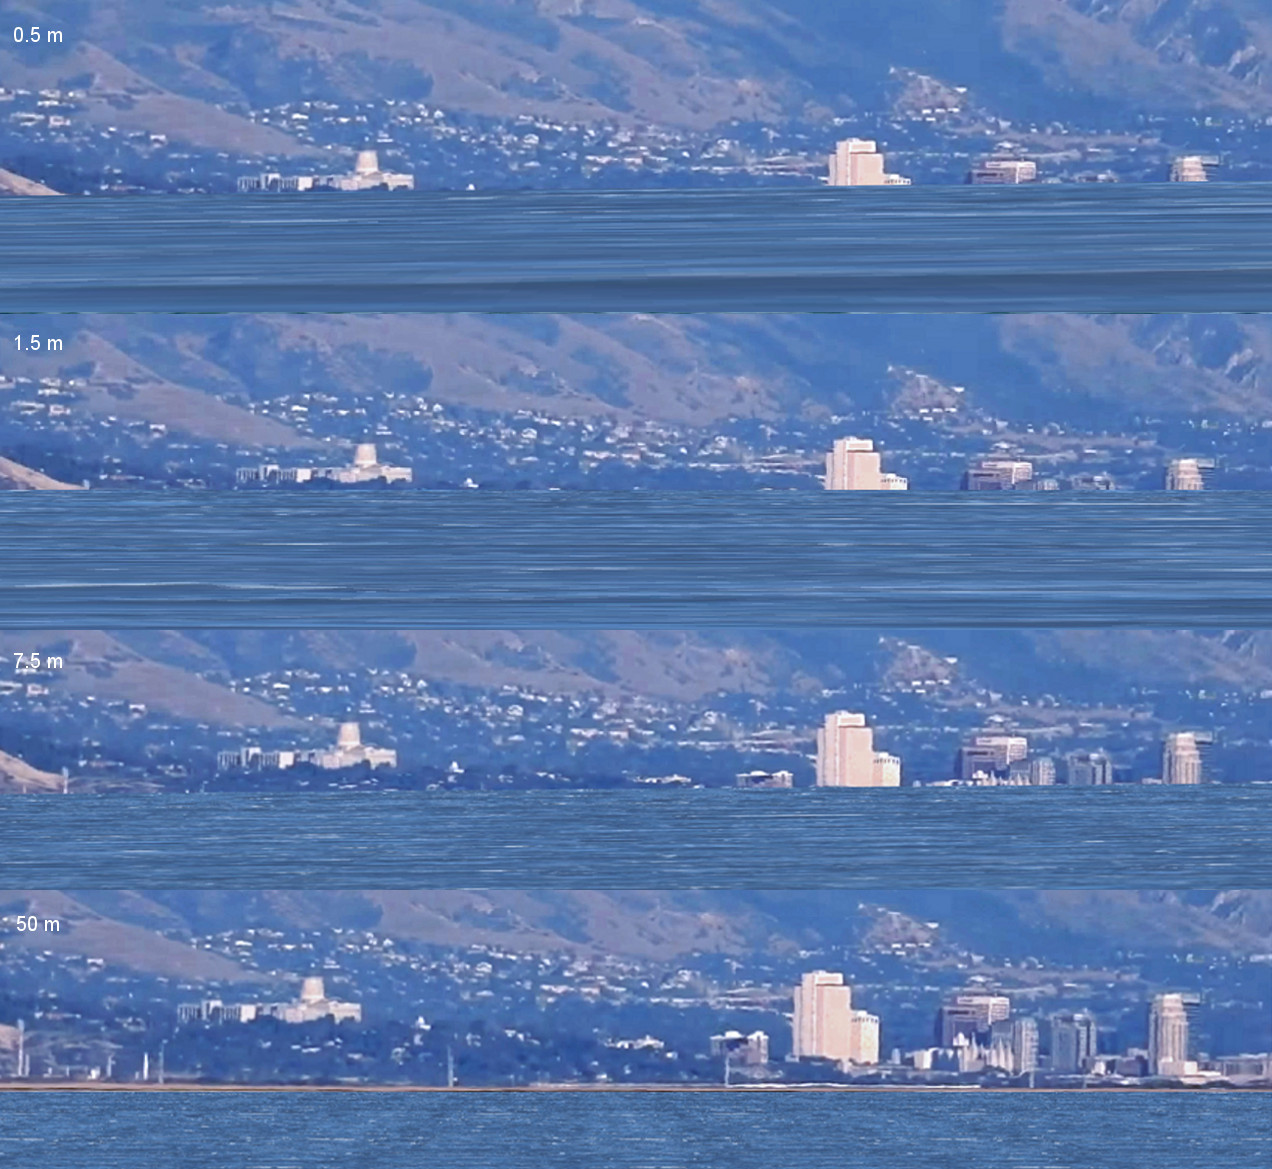
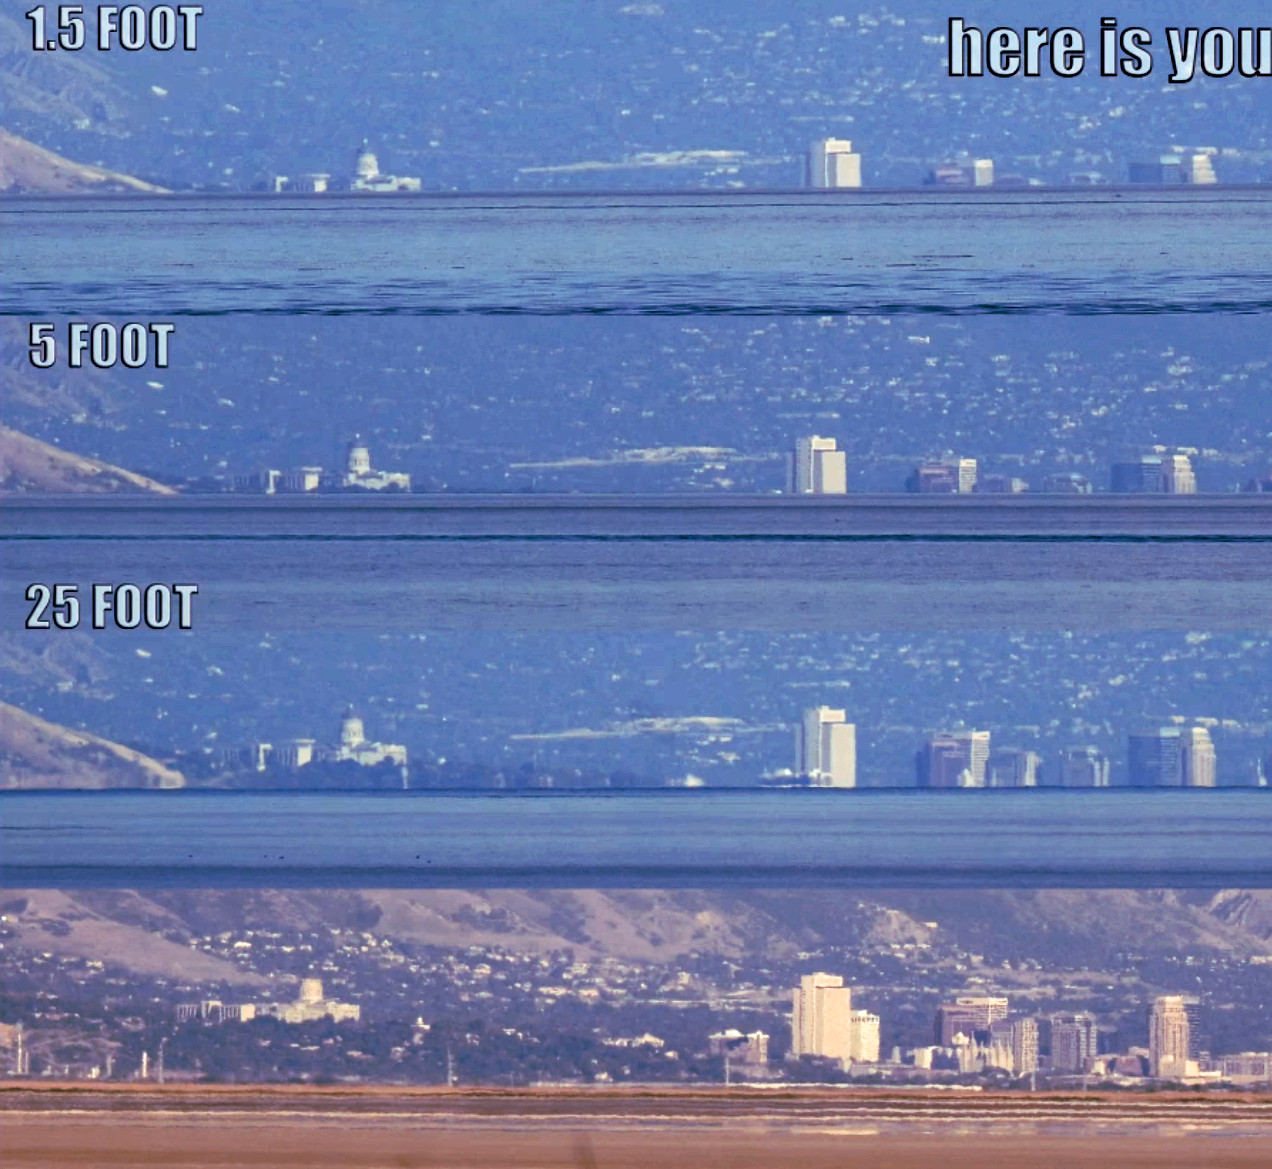
Observation of Salt Lake City from 40 km distance (top 3 images parts), showing how the water horizon hides the bottom part of the city as predicded by the Globe Model. The Flat-Earth model predictions do never hide anything of the city and do not match the footage at all.
 Globe Model Prediction of Refraction Simulator
 Flat-Earth Prediction of Refraction Simulator
- Swap
- Globe Model
- Flat-Earth Model
 Real Image from Salt Lake CityGlobe Model Prediction of Refraction SimulatorGlobe Model Prediction of Curvature App
- Blink Test
- Reality
- Globe Model
City observed and simulated at observer heights of 0.5 m, 1.5 m and 7.5 m. The bottom image part is from another location and higher up to show that the city is about 100 m above the Salt Lake.
Note that the simulation took the bottom image as the background. Because this image is taken from a different angle and zoom than the top 3 real images, the viewing angle and zoom to the buildings in the simulations do not match the footage. But the hidden parts do match because the vertical scaling of the buildings is the same in the simulation as on the footage.
Because the refraction was not known I had to try to find a refraction curve that matches the footage. I found that the water was probably slightly warmer than the air and some Stooping was goeing on. The Simulation shows, that no matter whether you chose zero Refraction, Standard Refraction or the Refraction Curve I used, there are always some parts of the bottom of the city and the buildings hidden from 1.5 m to 7.5 m. Only the amount and the distortion changes slightly.
Please try the Refraction Simulator yourself.
Comcast Skyscraper from Apple Pie Hill


- Swap
- Globe Model
- Flat-Earth Model
 Real Image through an Auto Level
 Real Image overlayed with Globe Model Prediction
- Blink Test
- Reality
- Globe Model Overlayed
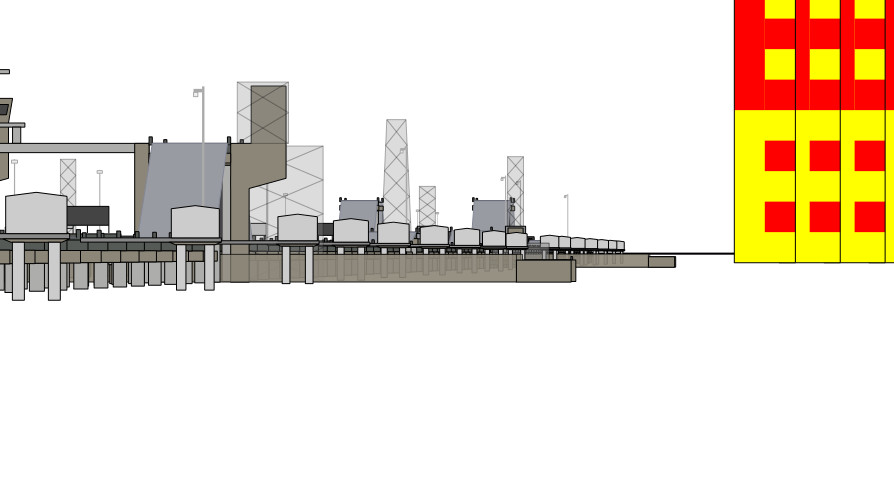
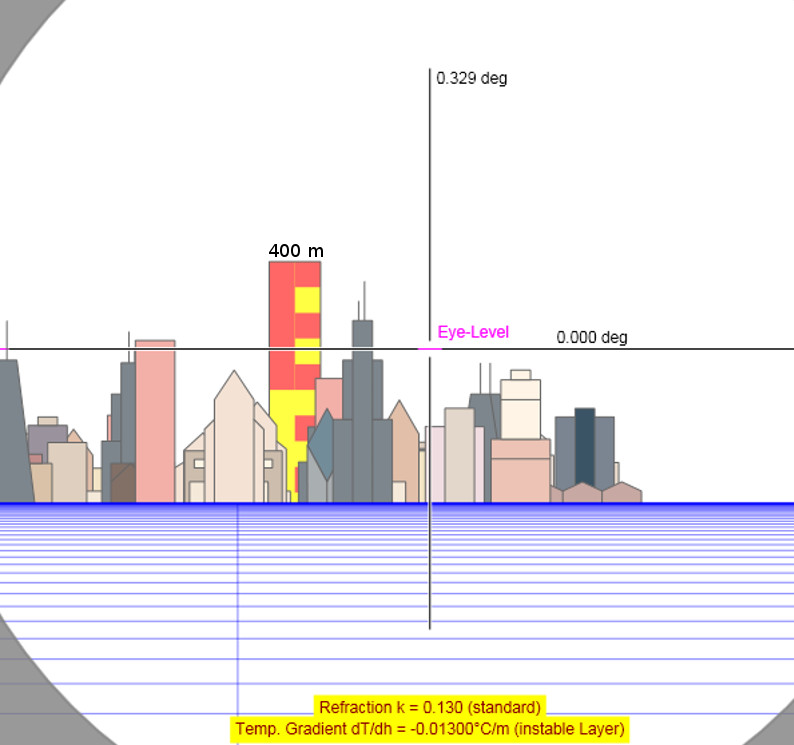
View to the Comcast Skyscraper of Philadelphia (gray building left of the crosshair) through the Auto Level of Jesse Kozlowski (a Geodetic Surveyor) from on top of Apple Pie Hill (62 m) Fire Tower (18 m) in southern New Jersey.
The Earth’s Curvature Plainly Visible, Viewing Philadelphia From Apple Pie Hill In New Jersey by Jesse Kozlowski
Detailed documentation of the observation with all data
The horizontal crosshair is at auto level elevation of about 78 m (256 Feet) NAVD88 and shows the Eye-Level plane from the observers location. The Eye-Level plane is perpendicular to the vertical at the observer location. The distance to the top southeast corner of the Comcast Center is 52.15 km (171,100.8 Feet = 32.4 Miles). The top of the skyscraper is at elevation 307.85 m (1010 Feet) NAVD88.
The crosshair (Eye-Level Plane) intersects the Comcast building at approximately 42 m (138 feet) +/- down from the top at 266 m (873 Feet). This is because the earth curves down. On a Flat Earth the crosshair (Eye-Level Plane) would intersect the building at Eye-Level altitude of 72 m, that is about 2 scales from the bottom on the measuring rod..
A Refraction Coefficient of k = 0.13 is applied on the Globe Model, which corresponds to Standard Refraction over land.
The yellow/red measuring rod in the model is 400 m tall with a 40 m scaling. The horizon on the Globe Model is at a distance of 33.8 km (21.0 Miles) and has dropped 156 m (512 Feet) from Eye-Level or 78 m (256 Feet) from sea level corresponding to a Dip Angle of 0.264° from Eye-Level.
Oil Platform Grace

- Swap
- Globe Model
- Flat-Earth Model
 Real Image of Oil Platform Grace
 Globe Earth Model Prediction
- Blink Test
- Reality
- Globe Model
Distance to Oil Platform = 28 km; Height = 37.2 m; Observer Altitude = 72 m; Anacapa Island Distance = 50.1 km; Height = 75 m; Zoom = 2000 mm
You can find Some graphical Explanation for this scene and a Demo in the Curvature App with all data to the scene. See also Video Oil Platforms and Islands | Observation and Analysis from Jon McIntyre
No amount of refraction can produce this image on a flat earth!
Windfarm Ormonde

 Panorama Image from Video footage of Miles Davis Flat-Earth: Earth Shape Tourists UK, St Bees Episode 1
 Panorama Image and Globe Model Prediction Overlayed


- Blink Test
- Reality
- Globe Model Overlay
- Globe Model
- Flat-Earth Model
View from St. Bees (GB) to Ormonde Windfarm:
Distance = 43.6 km; Observer Altitude = 14 m; Refraction = 0.2 (medium); Hub Height = 88 m; Tides = 2 m; Hidden = 57..75 m
Images from the ISS
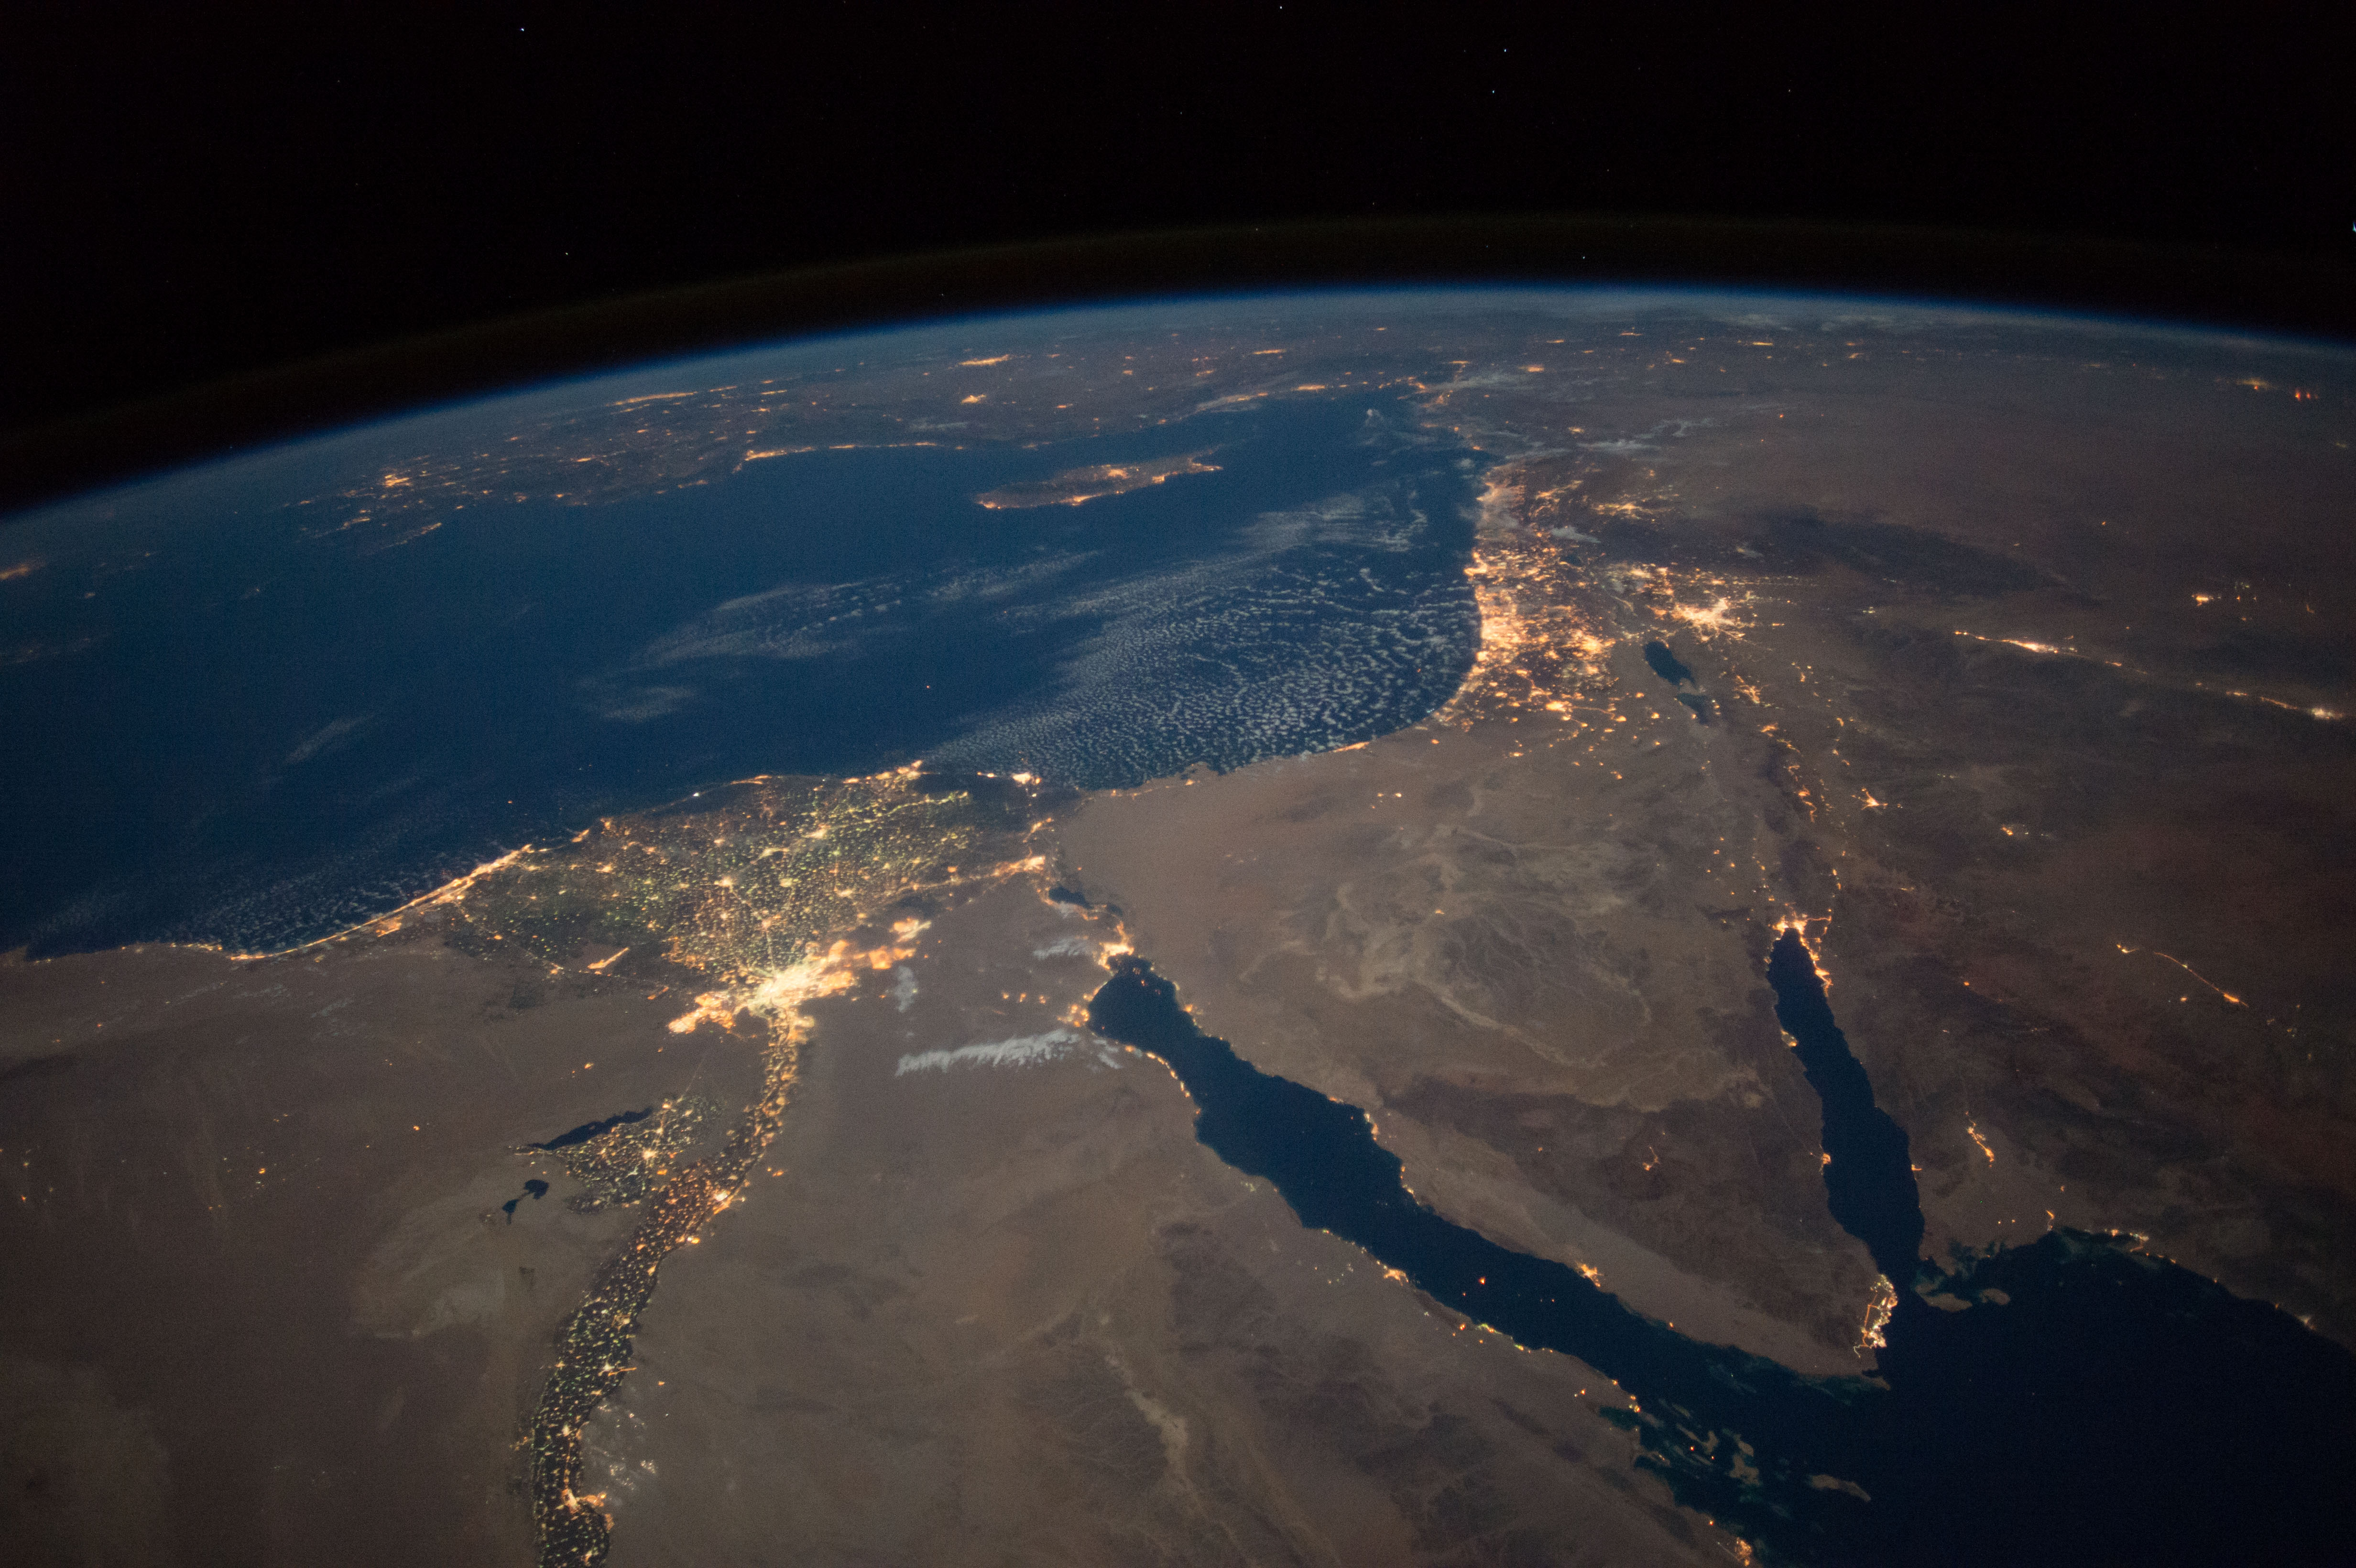
 Test whether the graphics of the simulation matches a real image taken from the ISS:
Height = 400 km; 35mm focal lengt f = 28 mm; Line Spacing 48.91 km
Date of recording: 16.09.2016 20:55; Source: NASA; Original image with EXIF Informations
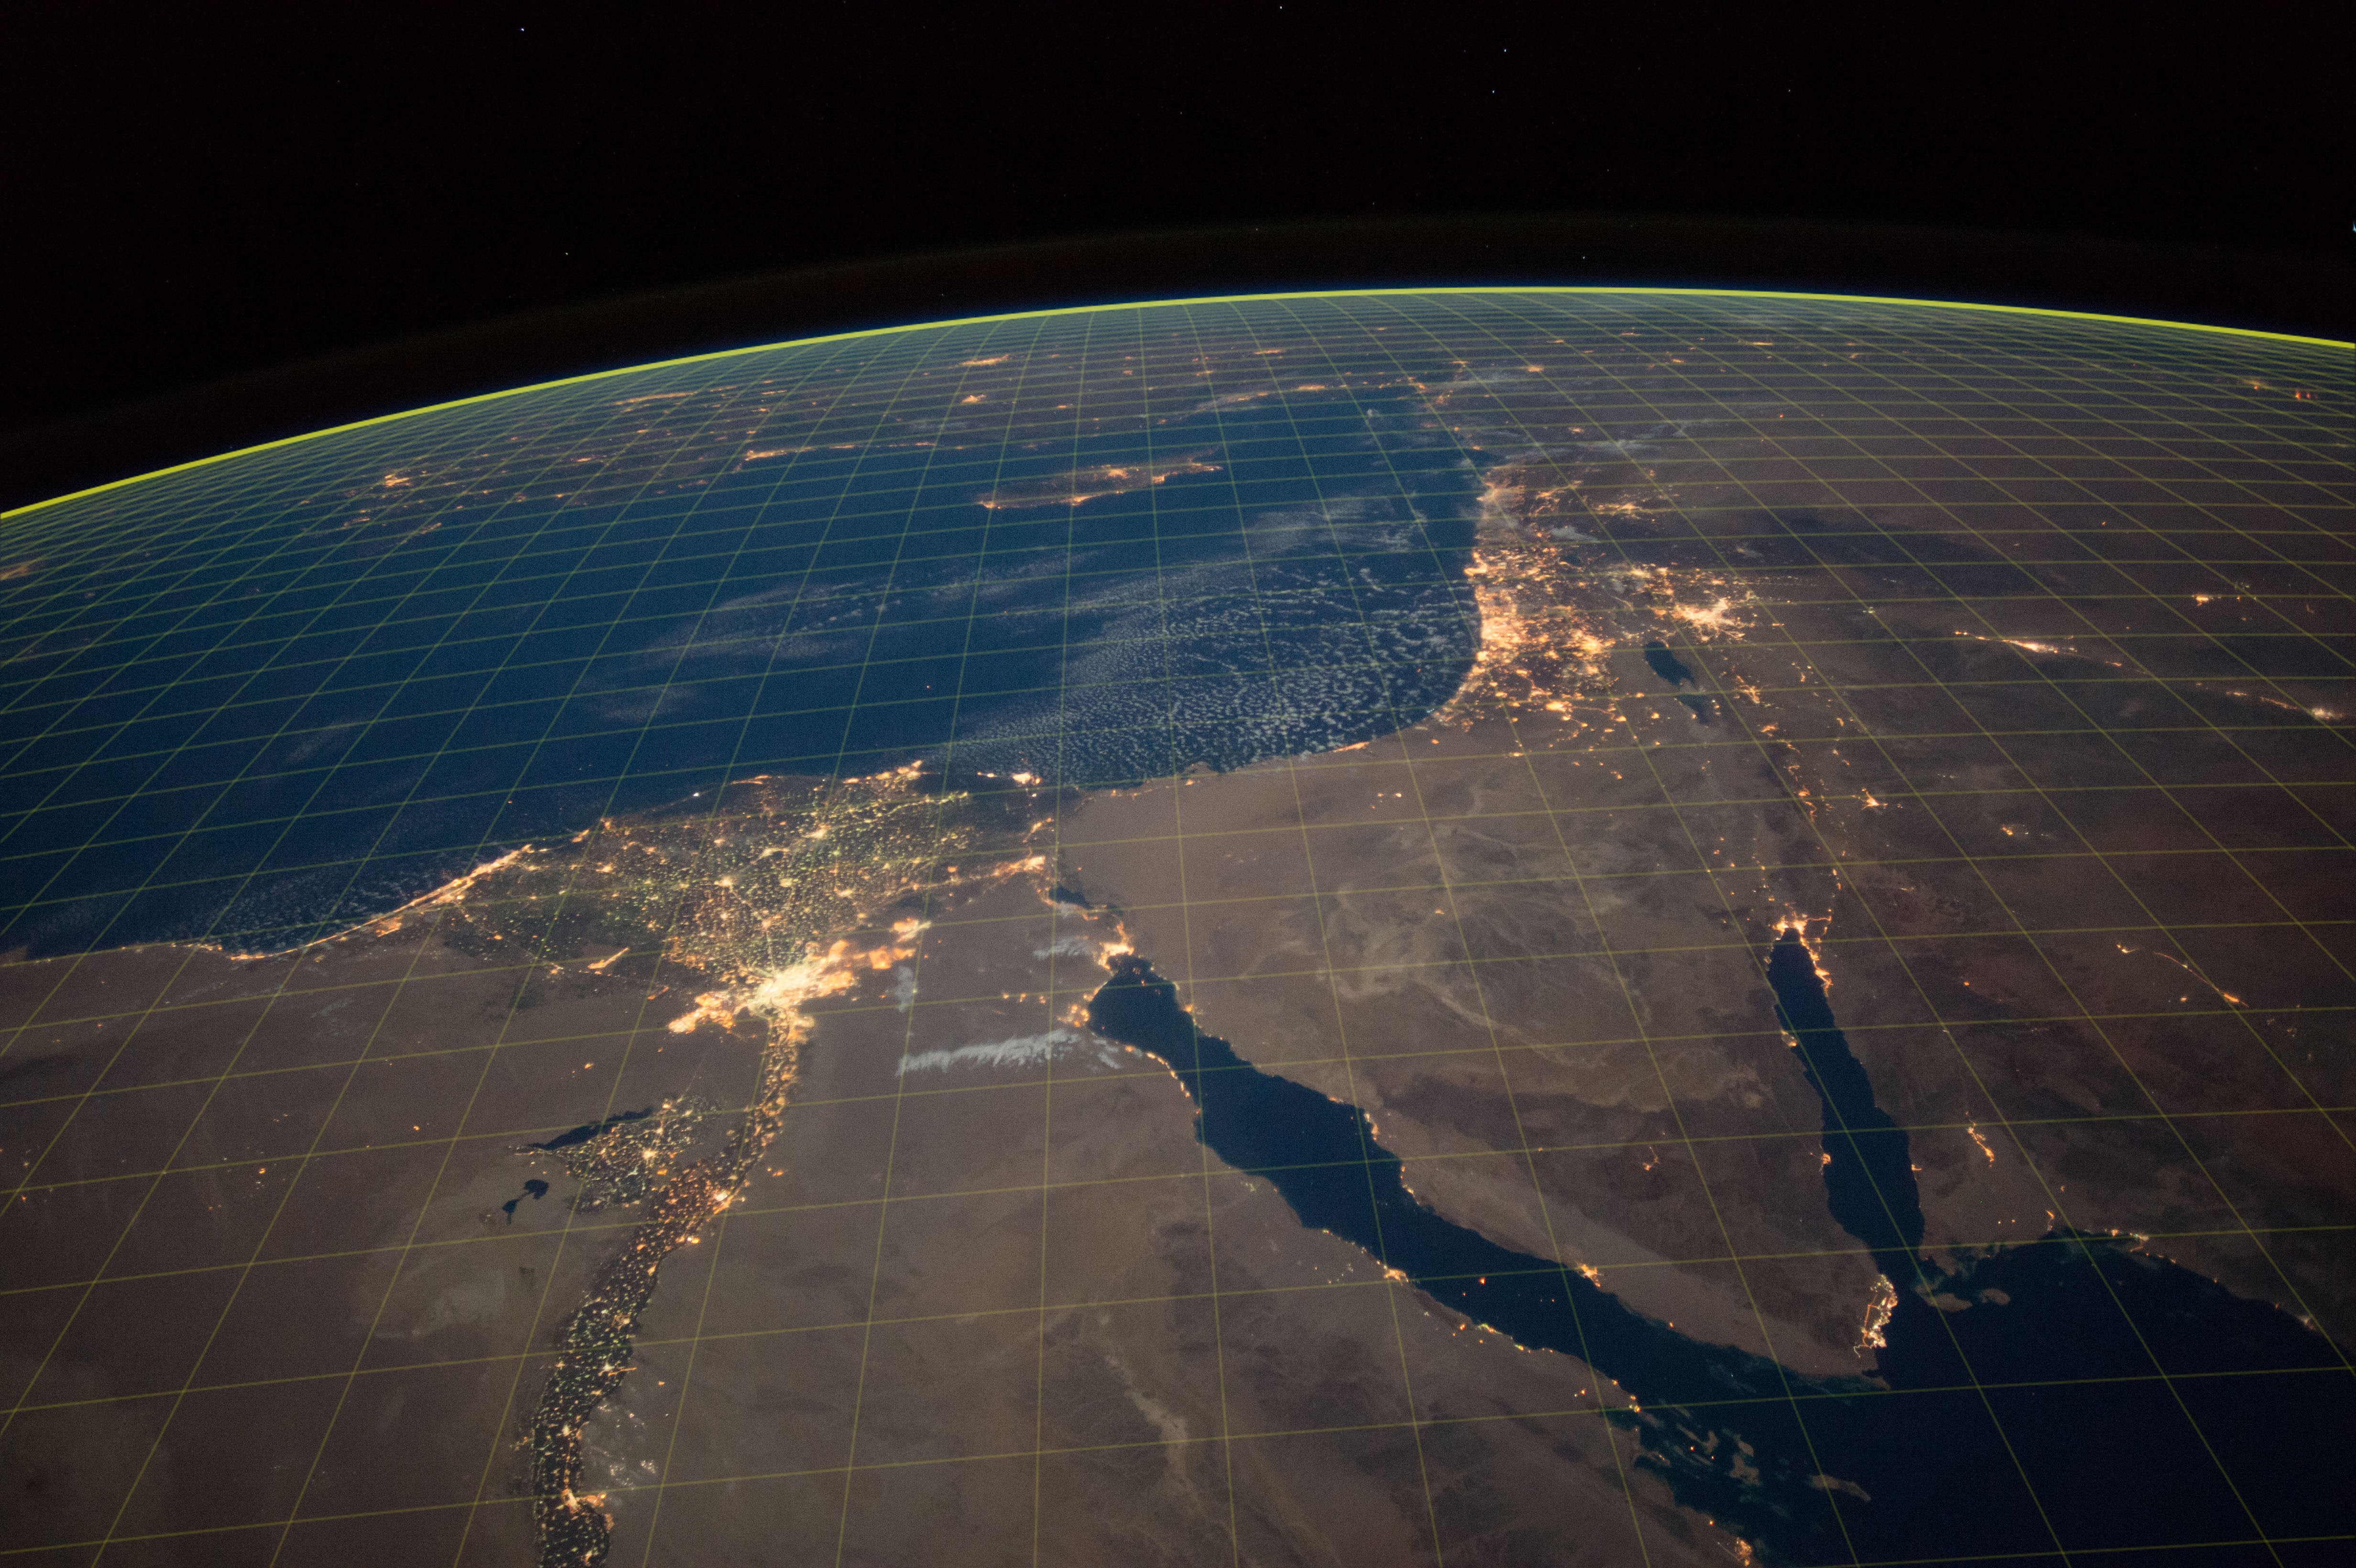
 Test whether the graphics of the simulation matches a real image taken from the ISS:
Height = 400 km; 35mm focal lengt f = 28 mm; Line Spacing 48.91 km
Date of recording: 16.09.2016 20:55; Source: NASA; Original image with EXIF Informations
- Blink Test
- Reality
- Globe Model Overlay
This image was taken by one of the astronauts Sergey Ryzhikov, Shane Kimbrough, Andrey Borisenko, Kate Rubins, Commander Anatoly Ivanishin or Takuya Onishi on board of the ISS Expedition 49 using a NIKON D4 camera using a 28 mm wide angle lens (35 mm equivalent, no fisheye). Links to the original image and all EXIF data are provided.
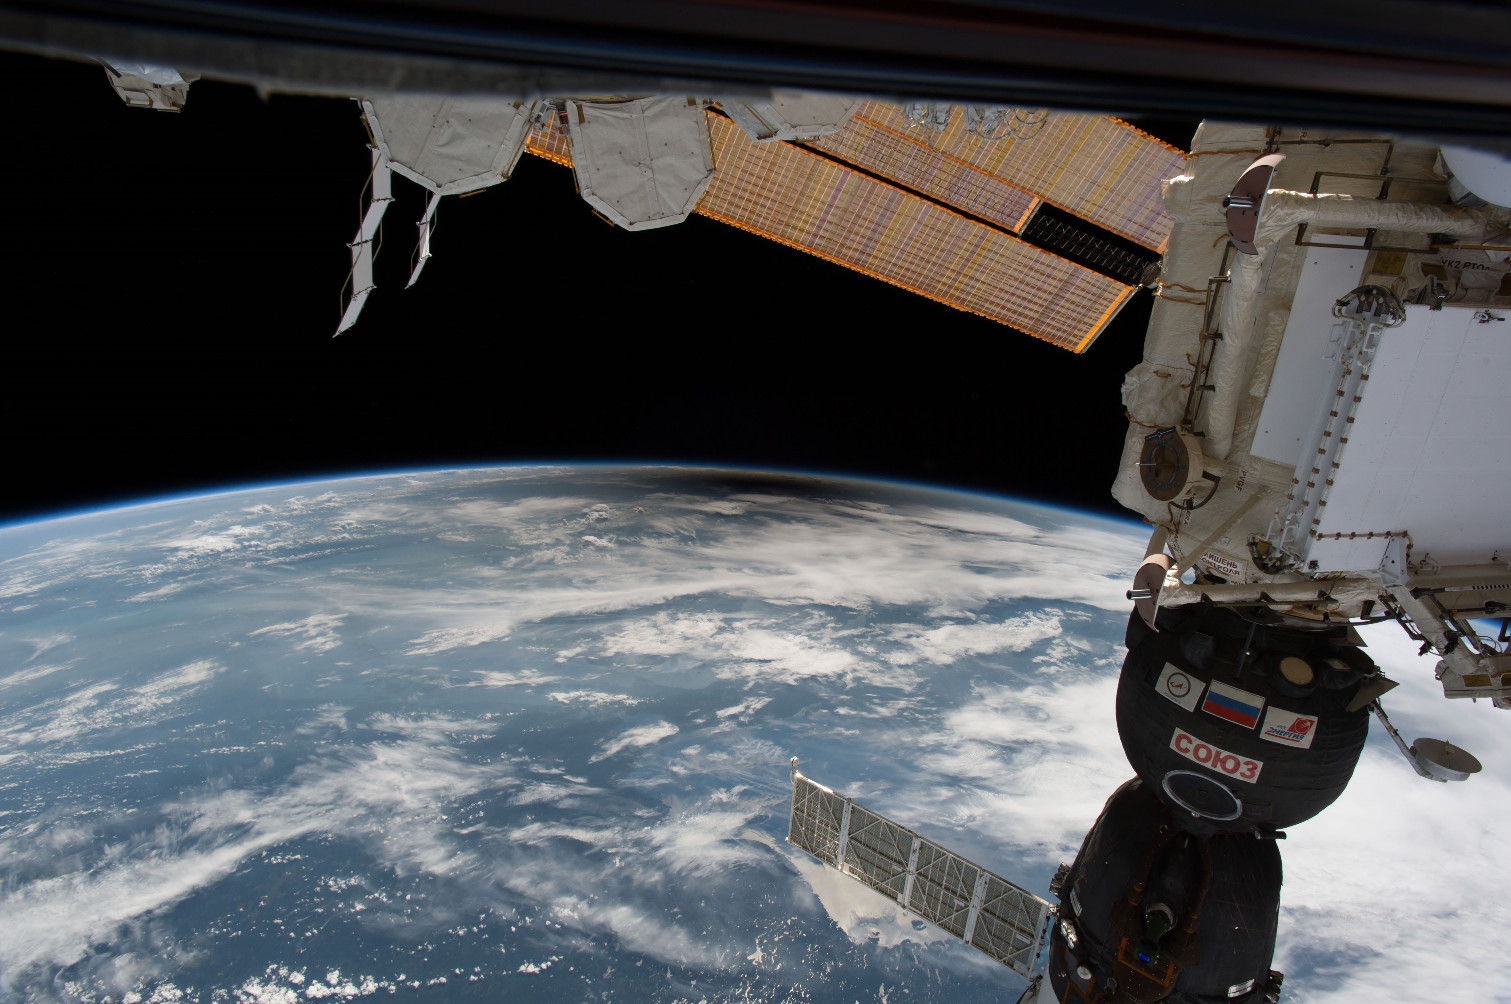
 Another picture taken from the ISS showing penumbra from the solar eclipse.
Height = 400 km; 35mm focal length f = 20 mm; Line Spacing 55.6 km
Original image with EXIF Informations

 Another picture taken from the ISS showing penumbra from the solar eclipse.
Height = 400 km; 35mm focal length f = 20 mm; Line Spacing 55.6 km
Original image with EXIF Informations
- Blink Test
- Reality
- Globe Model Overlay
This image shows the moon’s shadow (penumbra) from the solar eclipse on Aug. 21, 2017. It was taken by one of the astronauts Randy Bresnik, Jack Fischer, Peggy Whitson, Paolo Nespoli, Commander Fyodor Yurchikhin or Sergey Ryazanskiy using a NIKON D4 camera using a 20 mm wide angle lens (35 mm equivalent, no fisheye). Links to the original image and all EXIF data are provided.
Elon Musk’s Tesla in Space
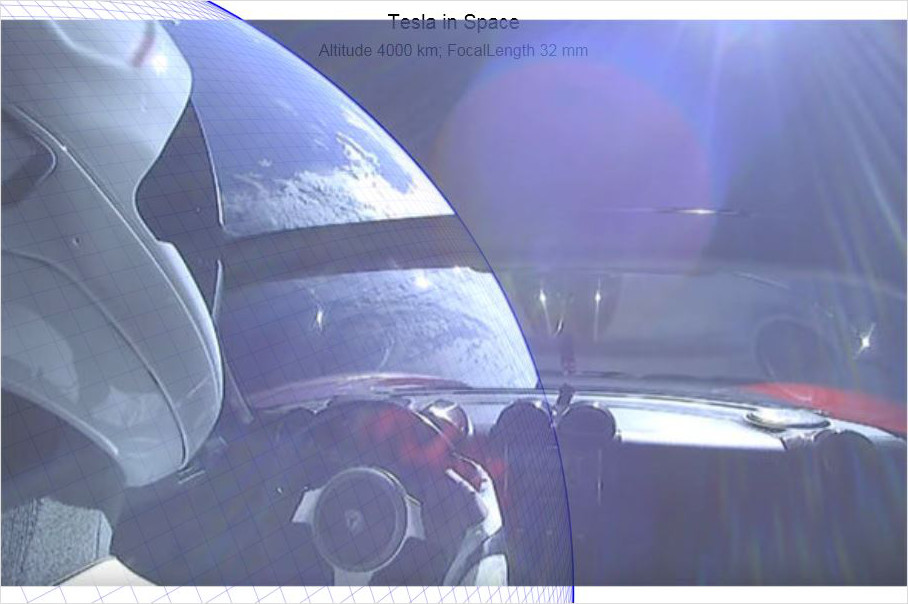

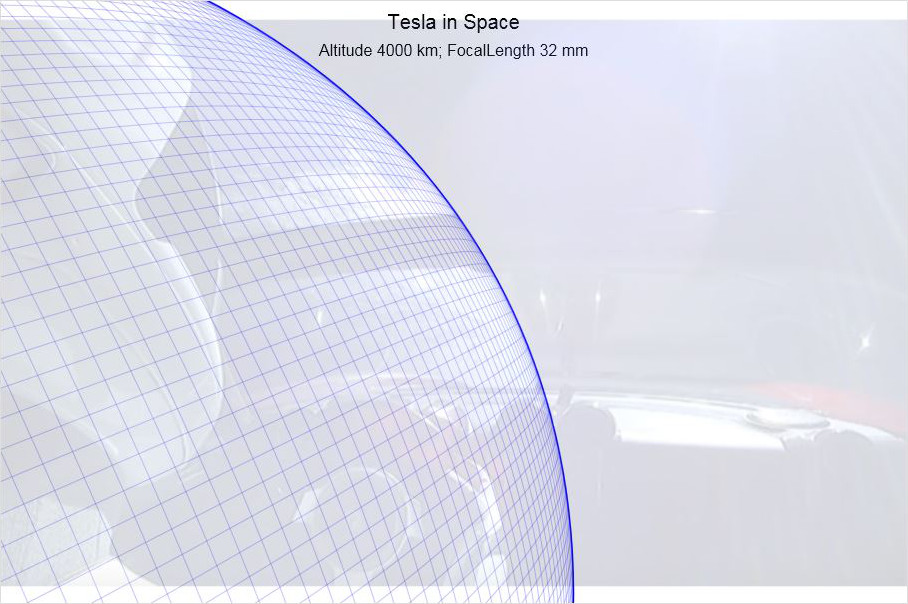

- Blink Test
- Reality
- Globe Model Overlay
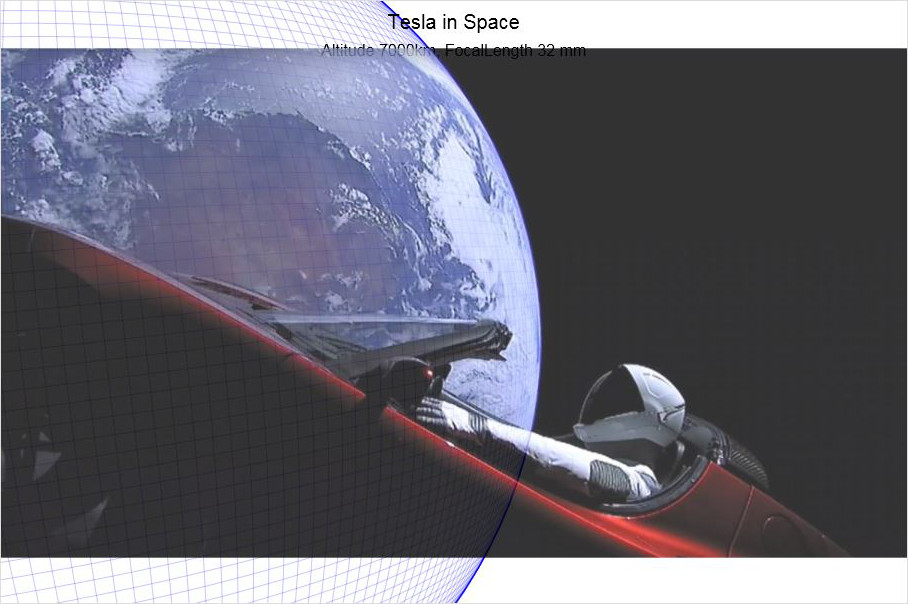

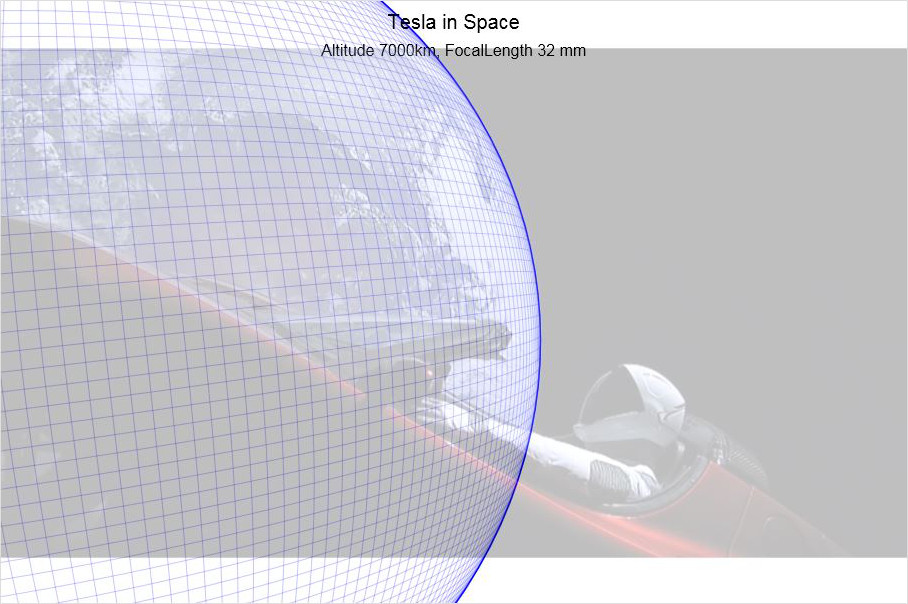

- Blink Test
- Reality
- Globe Model Overlay


TikTok: tiktok.com/@olegmks
ВКонтакте: vk.com/olegmks
YouTube: youtube.com/c/OlegMKS
Яндекс.Дзен: zen.yandex.ru/olegmks
RuTube: rutube.ru/channel/23320330/